I am trying to align the two y axis. In the link below, I am trying to get the right y axis to align with the left y axis.
For example, right now “6.5” in the in the right y axis aligns with approximately “14” on the left y axis where I would like it to align with the maximum left y axis which is currently has a value of “15”.
This part is tricky because you’re hard-coding tickPositions on both axes. When you do that, Highcharts ignores your min and max values, since the fixed ticks fully control the scale. That makes it unclear what range you actually want to display. Could you clarify what behavior you’re aiming for?
I would like the “6.5” n the right side to align with the “15” on the left side, the “2.5” on right side to align to the “3” on the left side, and the remaining values on the right side to be evenly spaced inbetween.
This one is a bit tricky because the left and right y-axes use different scales, so aligning values like 15 → 6.5 and 3 → 2.5 requires proportional mapping rather than just spacing the ticks evenly.
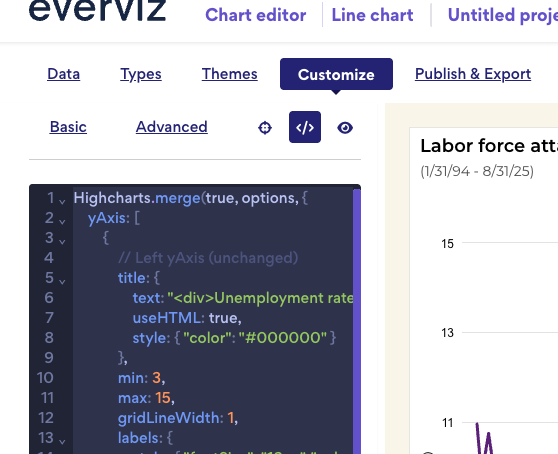
You can keep the axes consistent by using this custom code: Everviz example
Paste this code in Customize → Custom code section