Hello, I’m new to everviz and learning how everything works. I fortunately got some help building this chart. I would like to control where the connectors attach to the “bricks” (rectangles with text). The chart would be a lot cleaner if the connectors could start from the far right side of the left-hand column of bricks, and attach to the far left side of the right-hand column of bricks. Then they wouldn’t cross behind other bricks. Any tips on how to make this happen? Thank you so much in advance!
Hi Karen. Good to see you in the forum ![]()
I’ve tried a few different approaches to get this working but haven’t found a solution yet.
I think the correct option is:
Plot options > Series > Data Labels 1 > Align
However, when setting this to “left,” the boxes align to the left on both sides. It seems like we might need a programmatic left or right adjustment based on the position of the box.
I’ll follow up with our dev team for their input.
Cheers,
Havard
Hi Again Karen
Our developers found a solution using custom code. Here’s an example
Below is the full custom code including what you had before
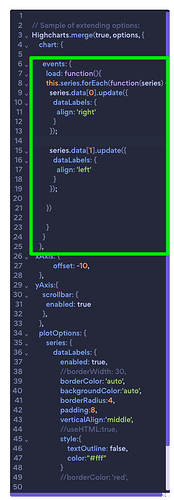
The magic is highlighted in this screenshot:
// Sample of extending options:
Highcharts.merge(true, options, {
    chart: {

      events: {
      	load: function(){
        this.series.forEach(function(series) {
          series.data[0].update({
            dataLabels: {
              align: 'right'
            }
          });

          series.data[1].update({
            dataLabels: {
              align: 'left'
            }
          });

        })

        }
      }
    },
  xAxis: {
            offset: -10,
    },
  yAxis:{
      scrollbar: {
        enabled: true
      },
    },
    plotOptions: {
        series: {
            dataLabels: {
                enabled: true,
                //borderWidth: 30,
                borderColor: 'auto',
                backgroundColor:'auto',
                borderRadius:4,
                padding:8,
                verticalAlign:'middle',
                //useHTML:true,
                style:{
                    textOutline: false,
                    color:"#fff"
                }
                //borderColor: 'red',

            }
        }
    }
});
You can copy the chart using this URL:
https://api.everviz.com/create?uuid=flFxbXuQL
I made some other small tweaks to make it more responsive
Havard, thank you so much for taking the time to dig into this and find a solution! We’ve got it up and running now. Thanks!
Hi Havard, we aren’t able to get the “reuse this chart” link to work-- we get an error.
Oh Sorry! This this: https://app.everviz.com/create?uuid=flFxbXuQL
