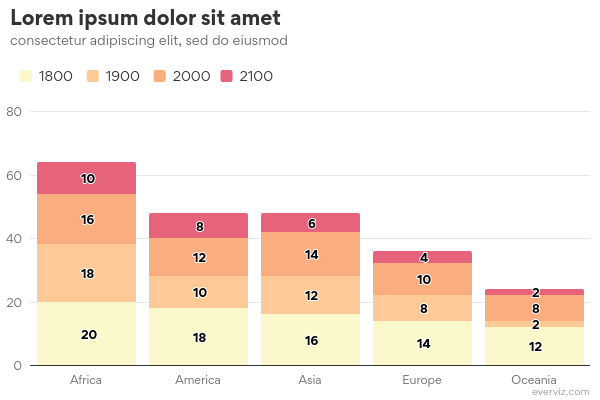
I have a stacked column chart - as well as showing the value of each segment of the stack in the tooltip, can I also show the total value for the column?
(N.B. I need this to happen in the advanced tooltip menu, not the basic menu (as that is not working)
Hi there
I don’t believe it’s possible through the Advanced menu, but you can achieve it using Custom Code.
Here’s a code snippet you can try:
Highcharts.merge(true, options, {
    yAxis: {
      stackLabels: {
        enabled: true,
        style: {
          fontWeight: 'bold',
          color:  '#000'
        }
      }
    },
});
Example:
Thanks very much - is it possible to put it i the tooltip rather than the stack labels?
Tim
I have worked out some code that does it nicely - at least in the Everviz webpage - but then the graph doesn’t appear publicly.
https://app.everviz.com/share/3pBrXu-V4
Any ideas?
Highcharts.merge(true, options, {
xAxis: {
// Ensure data is an array before mapping to categories
categories: Array.isArray(data) ? data.map(d => d.Date) :  // Populate categories from data if valid
},
plotOptions: {
series: {
stacking: ‘normal’ // Enable stacking
}
},
tooltip: {
headerFormat: ‘{point.key}
’,
pointFormatter: function () {
var point = this,
stackTotal = point.stackTotal !== undefined ? point.stackTotal.toLocaleString() : ‘N/A’, // Format stack total with commas
segmentValue = point.y.toLocaleString(); // Format segment value with commas
// Format the tooltip content: segment value + total in stack
return ‘’ + point.series.name + ‘: ’ + segmentValue + ‘’ + ‘
’+
'Quarter total (to date): ’ + ‘’+stackTotal;
}
}
});
Great work
I see an error in the console when loading your chart
Uncaught ReferenceError: data is not defined
I think this is related to the first part of your custom code:
xAxis: {
// Ensure data is an array before mapping to categories
categories: Array.isArray(data) ? data.map(d => d.Date) : // Populate categories from data if valid
},
It’s not entirely clear what this code should do, but the chart is rendering on my side if I remove this part
Hope this helps
Best regards,
Havard
