Hey Chris, and I hope you summer has been treating you well so far.
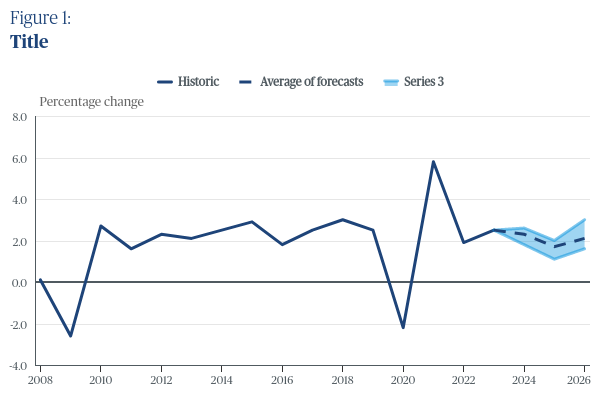
My first thought was to change the series name in the data panel. However, it seems like the series are called something else there - and somehow they have different names in the legend.
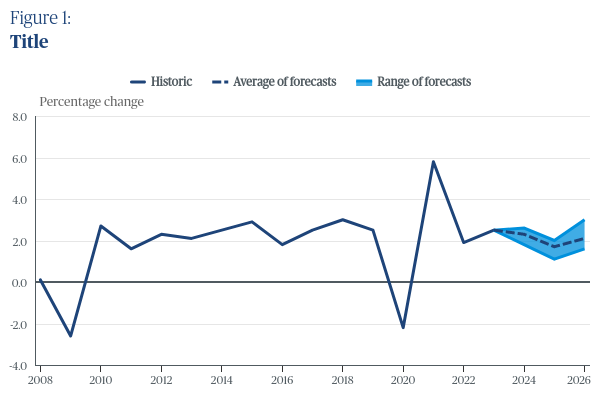
I tried to look in the advanced menu for series 3 - Tooltip for z index options, to push the area range series ‘forward’ so it’s triggered first on mouseover. No dice. Seems like hover over the points in the arearange exposes it. I guess you want the whole thing to show on hover.
Since the range series is of multiple parameters, it appears one of the serie names aren’t selected by default by the software.
The name key exist for any serie type, you can set this in Advanced > Series > [3] > Name
For range charts, the series itself is hoverable, not directly the edges of its (low, high). You can insert the two point values into your toolitp.
{point.high_forecast}
{point.low_forecast}
These values will take space but not show on the other points where they are not present. I advise formatting the tooltip to account for this. It’s good design practice to have a fixed space for items which may appear and reappear.