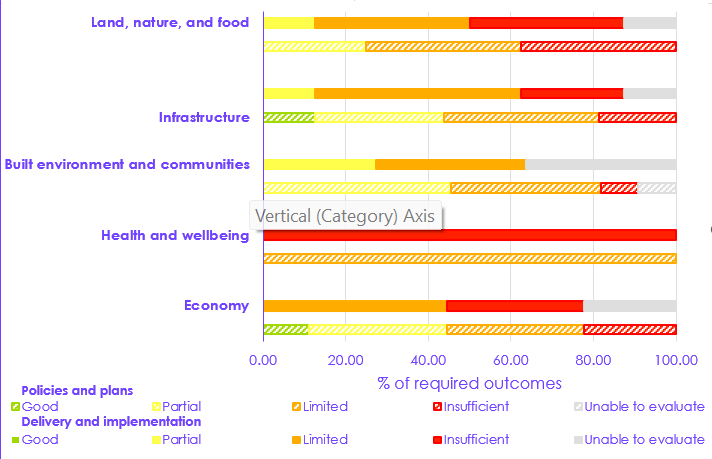
I am trying to make a stacked bar chart that has 10 series. Across the ten series there are 2 groups: ‘Delivery’, ‘Policies and plans’.
How can I make half of the bars hashed so that they appear differently and then specify this in the legend?
Thanks for reaching out. I might be wrong, but if you want to split the columns just like in this example: Everviz Example. You can achieve this by using highlights in the annotation section.
Here’s how:
Go to Customize → Annotations .
Add two vertical highlights and adjust their range to split the chart into two sections.
Label them as needed.
If you want to create a middle divider, add another vertical highlight, as shown in the example.
For more details on annotations, you can check out this knowledge base article: Working with Highlights.
But for legend one i think its not possible right now the way you want it.