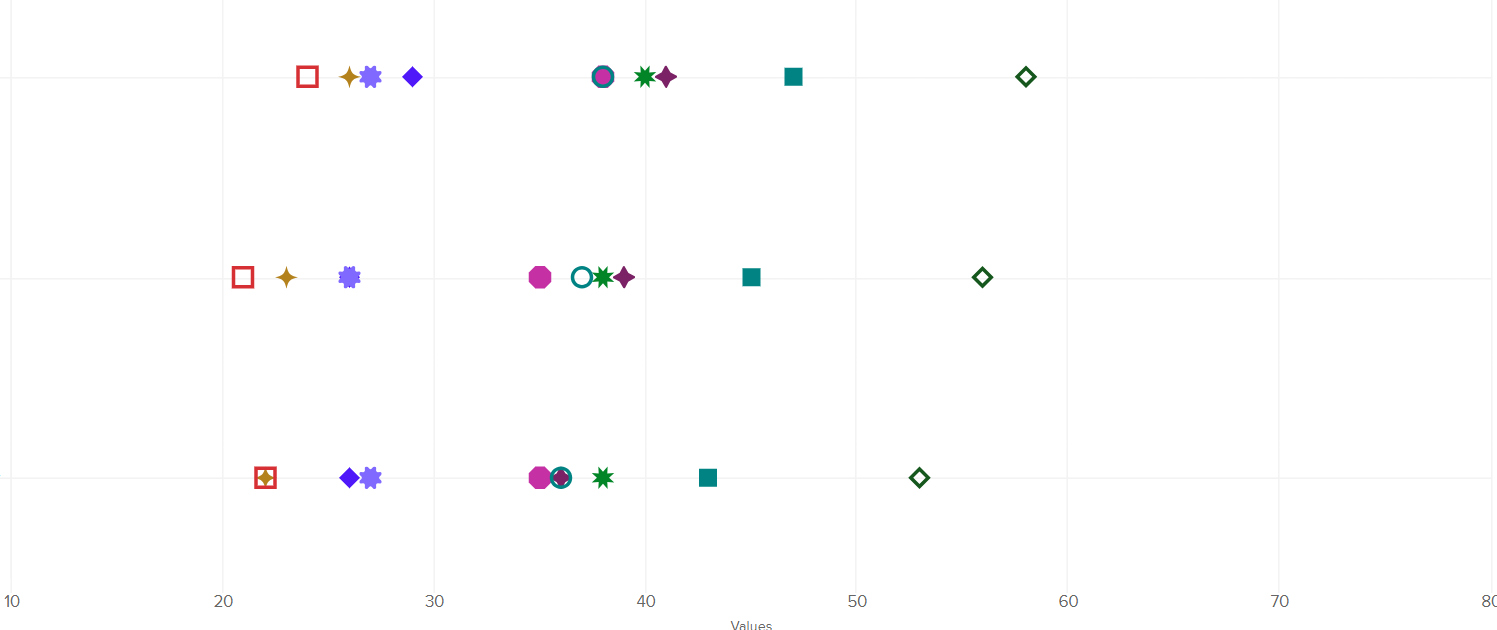
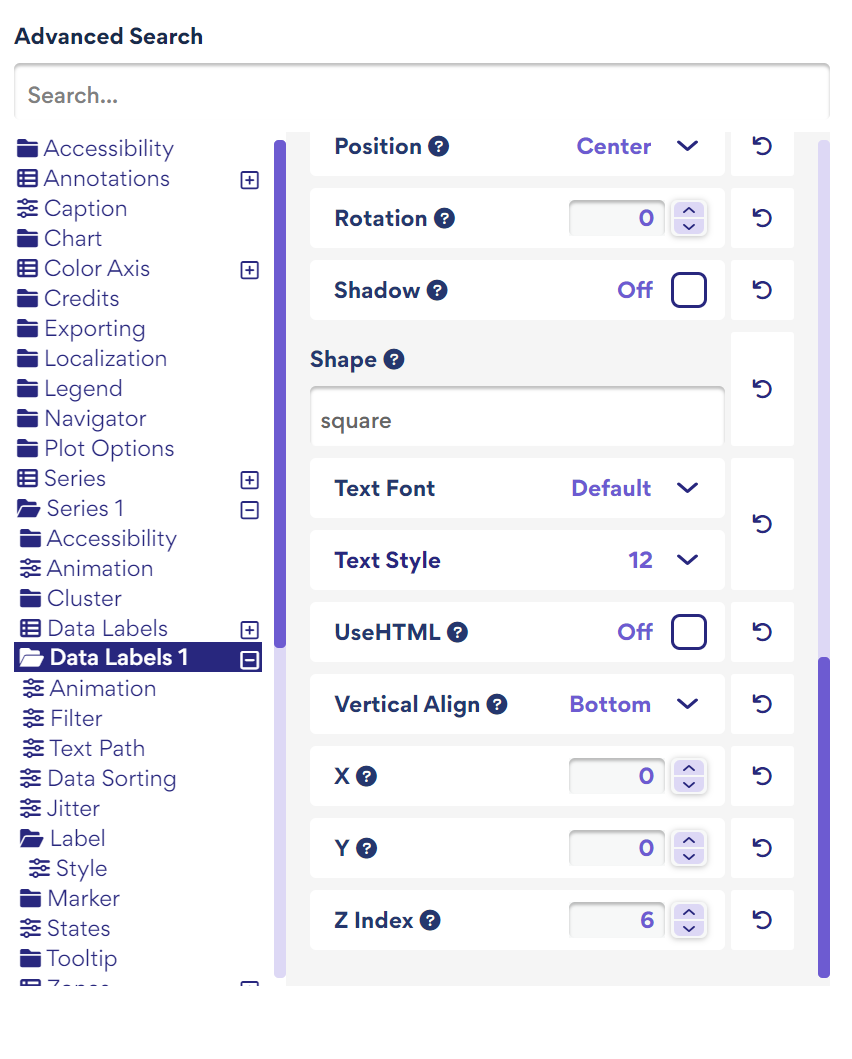
I am trying to manually change the data label icons for the following dot plot that currently has 11 series (a lot, I know!) but I’m having trouble. Under Data Labels in the Advanced editing window, an info question mark next to “Shape” below says the shapes are “predefined functions of the renderer object.” I don’t know what that means and it’s unlikely that I have access within my org to change if it is a very back-end thing. Any help would be greatly apprecaited!
Thanks, Ellyn. Following up on our chat, I’m posting the solution here in case anyone else encounters a similar issue.
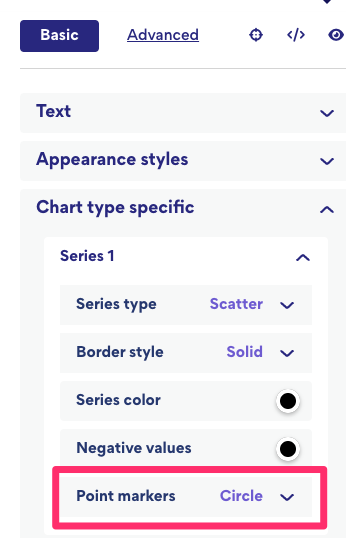
You can customize the markers in your chart by going to Basic > Chart Type Specific > Series X > Point Markers.
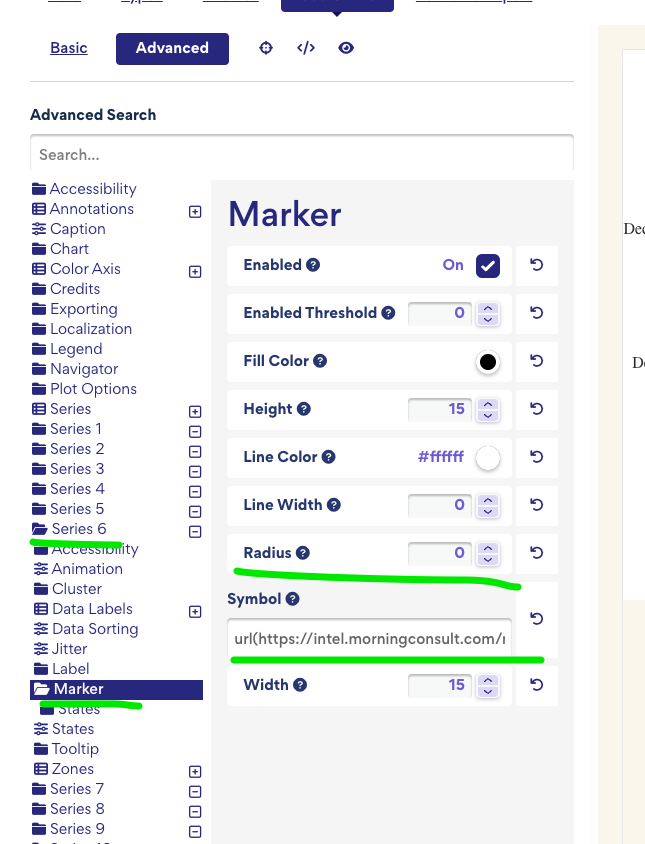
Since you were using custom symbols by loading external files, we needed to ensure that the radius was consistent across all the symbols to keep them the same size.
This adjustment was made under Advanced > Series X > Marker.
Cheers,
Havard