Shift Axis ticks or labels?

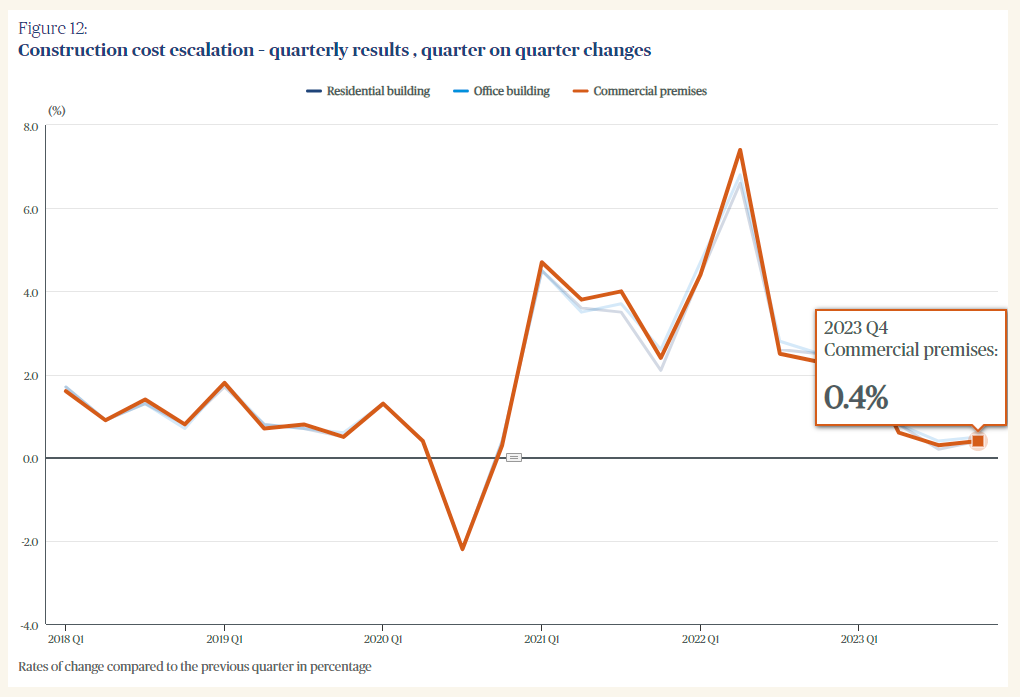
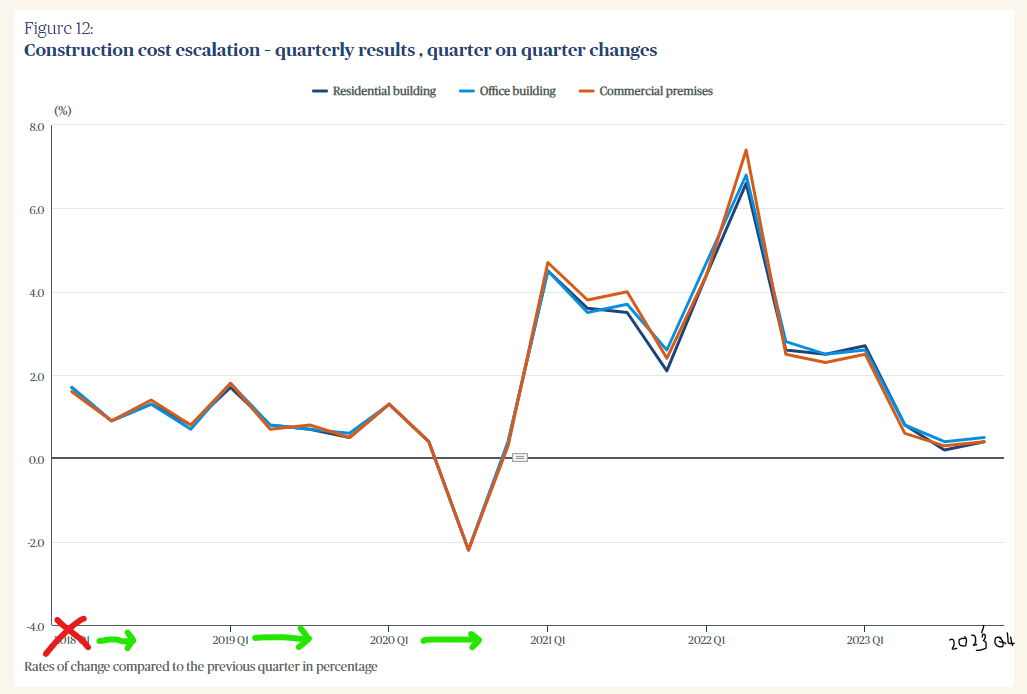
Here I want to show the Q4 2023 tick mark/label that’s shown by my tool tip, but no amount of adjusting my tick interval can help me with this.

I think it maybe because of an uneven number of data points? But not sure?

I still want to show the data for 2018 Q1, but would happy to start my tick labels a few Quarters after this to show the 2023 Q4 data label on my axis.

Thanks

Chris

@KerryHolm or @Mark

Any ideas?

Thanks in advance

Hi Chris

I couldn’t find an easy way to display the last label when using tick intervals of 4, but I found a workaround using custom code:

Highcharts.merge(true, options, {
xAxis: {
tickPositions: [0,4,8,12,16,20,23],
},
});

Inspo from this thread: How to draw last label of xAxis using xAxis Steps. - Highcharts official support forum

2 Likes

Amazing Havard, thank you!

:pray: