For example in https://app.everviz.com/edit/536607?editor&panel=chart_customize
I like 1000 1200 1400 1600 to see it like this 1.000 1.200 1.400 1.600
€ {value:.,f}
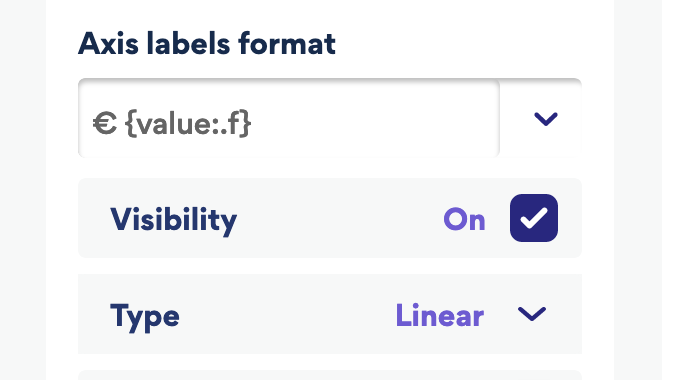
But how do I get the point, the thousand separator?
Do I add it in the data itself?
I removed all points from .csv files because it seems better when importing data.
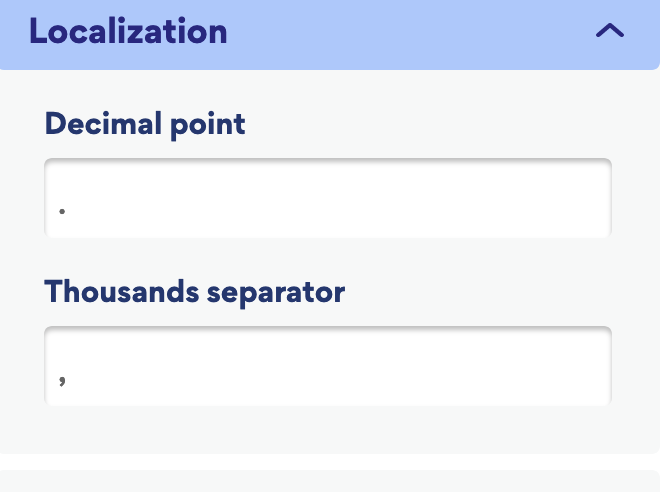
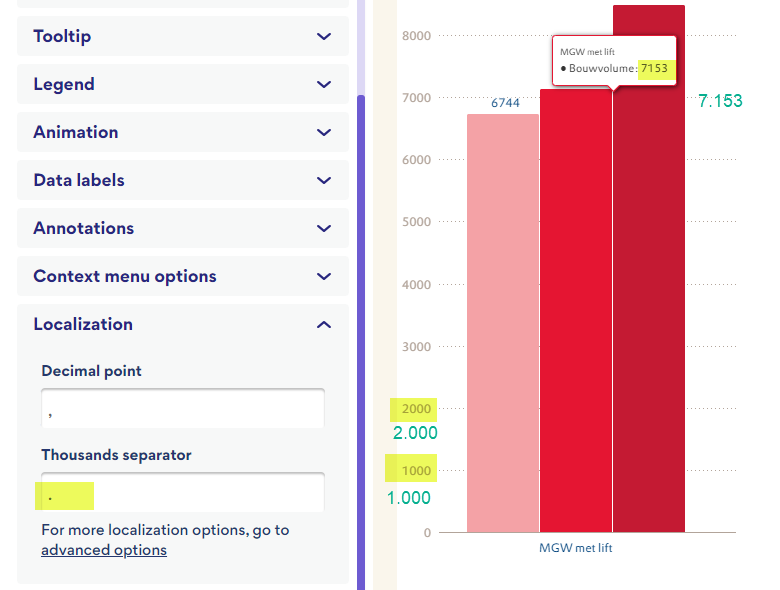
You can set the delimiter in Basic, under Localization:
That’s what I did, but numbers are still wihout a point:
See for example: https://app.everviz.com/edit/537035?editor&panel=chart_customize
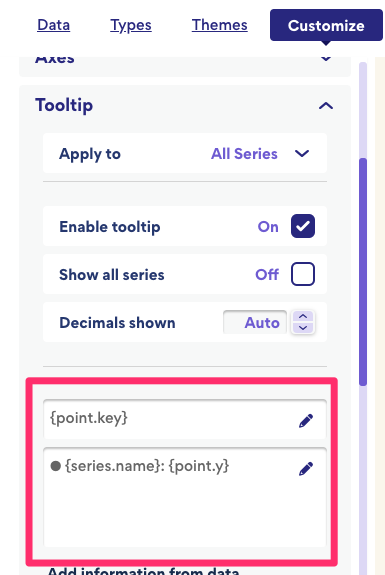
You need to add the same value formatting as I shared above specifically for the tooltip.
Sorry, I don’t understand where to add {value:.f}
In localization or Y-Axis? I tried both but without result.
Hi Caroline
If I’ve grasped it correctly, you’re interested in customizing tooltip values. You can achieve this by selecting Tooltip in the basic editor and incorporating the formatting in the header/body fields. Refer to the screenshot for guidance. Please let us know if this helps. Thanks
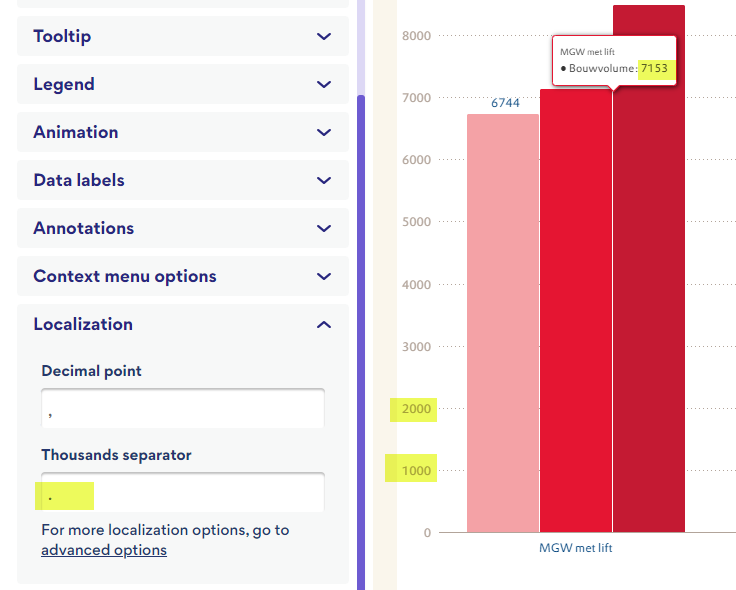
This does not make a thousand separator in numbers.
I removed formatting from csv file, so all imported data is without point.
How do I get the points back in tooltip and values on y-axis.
See image:
1000 should be written as 1.000 etc
Hi, as mentioned above, you need to insert the :.,f bit.
The image above is about the tooltip. In the tooltip the view of thousands are correct.(suddenly last week it was correct, I didn’t change settings. )
I want the thousand separator in the data labels and on vertical y-axis, the notation {value:.f} does not work in fields for the data labels and on vertical y-axis.
I thought this will be set by enter a point in localization. There is a point but it is not visible on y-axis and data-label.
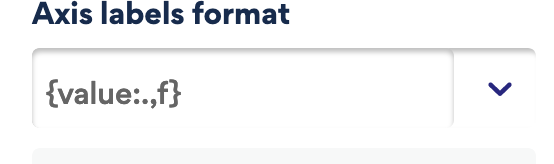
Sorry, I was wrong. You need to use:
for
{value:.,f}
Note the decimal. I am updating my prior answer.
Yes great that’s it!