By default, everviz will try to display values on the vertical axis without showing decimals less than 1 if there is enough space to do so.
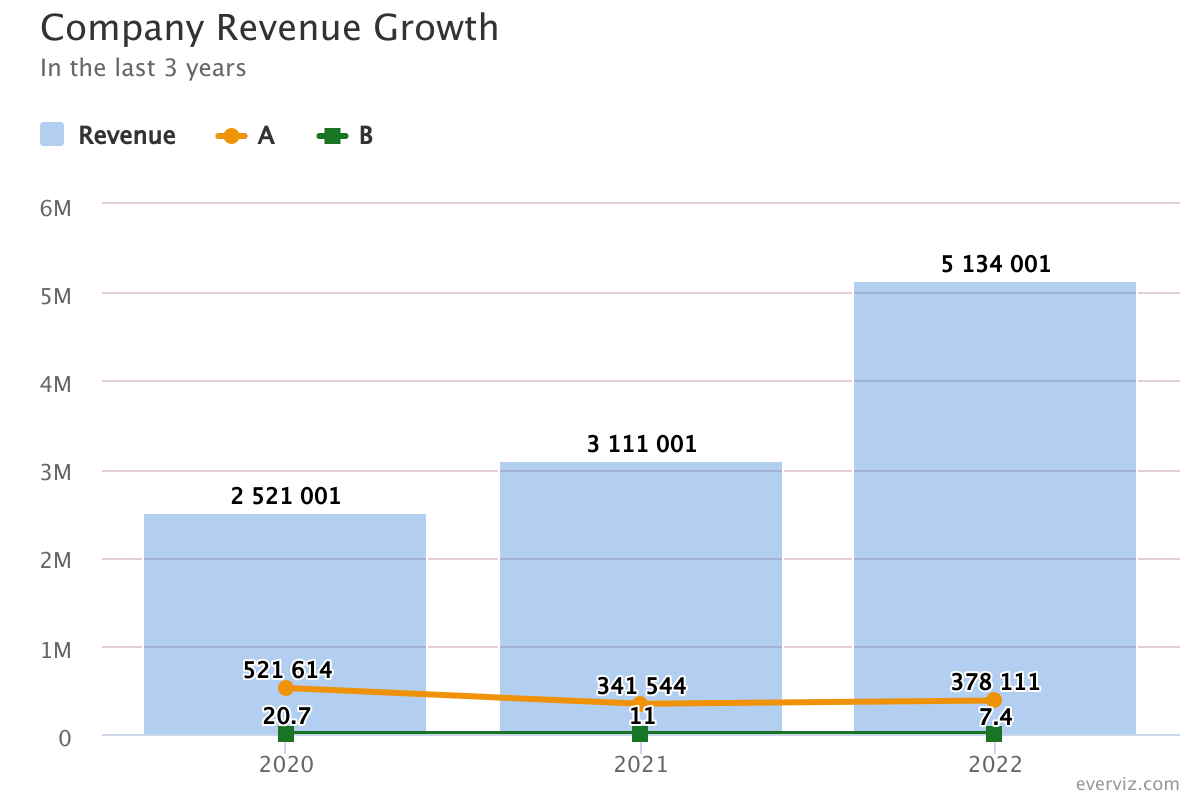
If you open the above chart at the url https://app.everviz.com/embed/pe3gPX1t-/?v=1 you will see what I mean.
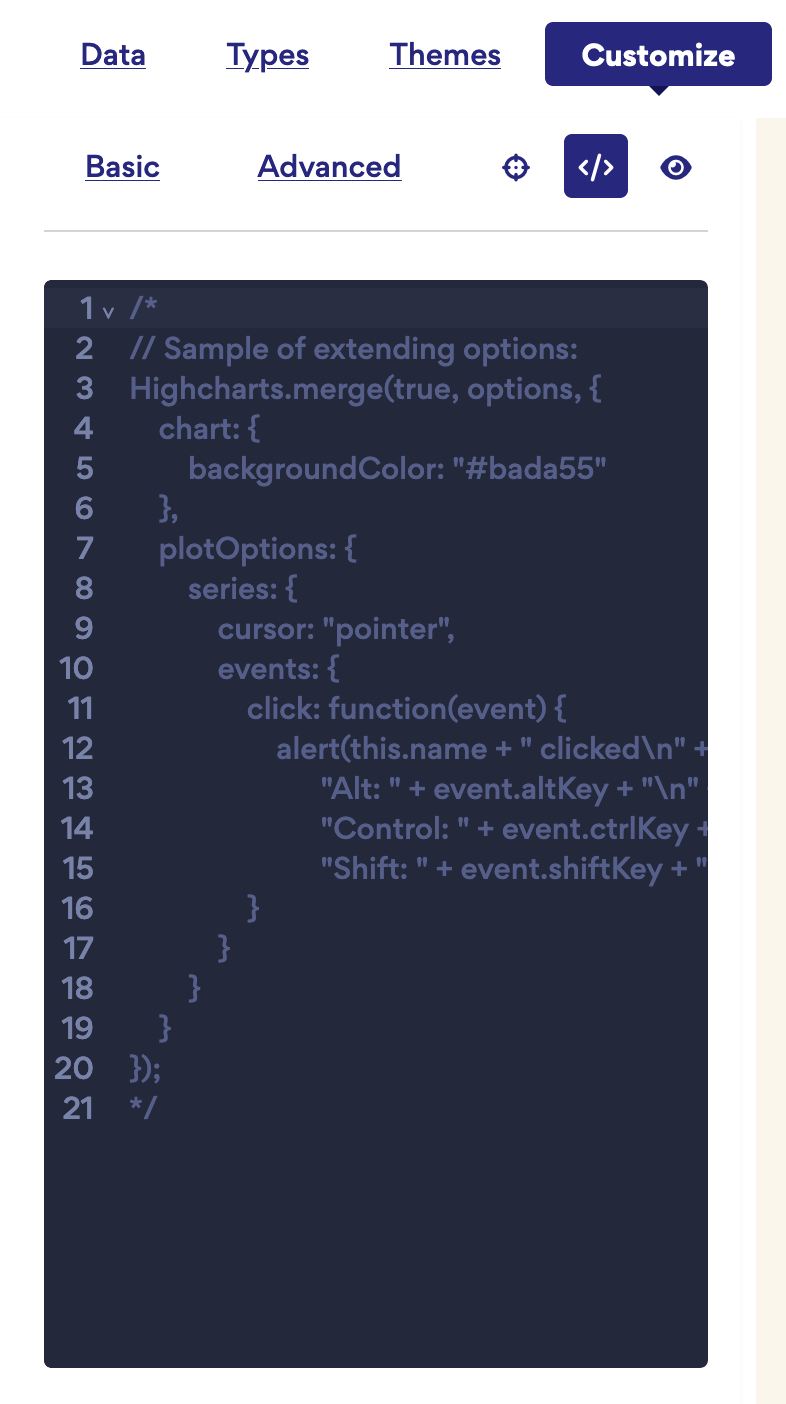
Sometimes, this is not desirable. In such cases it is possible to override this behavior with custom code:, which is accessible from the sidebar:
Before you proceed, make sure you have set Basic > Axis > Any > Format to include {text}, e.g., ${text}.
function isNumber(n) {
  return typeof n === 'number' && !isNaN(n) && n < Infinity && n > -Infinity;
}

Highcharts.merge(true, options, {
  yAxis: {
    labels: {
      formatter: undefined
    }
  }
})

// https://github.com/highcharts/highcharts/blob/master/ts/Core/Axis/Axis.ts#L608
function defaultLabelFormatter() {
  const axis = this.axis,
    chart = this.chart,
    {
      numberFormatter
    } = chart,
    value = isNumber(this.value) ? this.value : NaN,
    time = axis.chart.time,
    categories = axis.categories,
    dateTimeLabelFormat = this.dateTimeLabelFormat,
    lang = this.chart.options.lang,
    numericSymbols = lang.numericSymbols,
    numSymMagnitude = lang.numericSymbolMagnitude || 1000,
    // make sure the same symbol is added for all labels on a linear
    // axis
    numericSymbolDetector = axis.logarithmic ?
    Math.abs(value) :
    axis.tickInterval;

  let i = numericSymbols && numericSymbols.length,
    multi,
    ret;

  if (categories) {
    ret = `${this.value}`;

  } else if (dateTimeLabelFormat) { // datetime axis
    ret = time.dateFormat(dateTimeLabelFormat, value);

  } else if (i && numericSymbolDetector) {
    // Decide whether we should add a numeric symbol like k (thousands)
    // or M (millions). If we are to enable this in tooltip or other
    // places as well, we can move this logic to the numberFormatter and
    // enable it by a parameter.
    while (i-- && typeof ret === 'undefined') {

      if (value) {
        multi = Math.pow(numSymMagnitude, i + 1);
        if (
          (value < 1e6 && value >= 1e3 && value >= multi) ||
          (value >= 1e6 && i === 1)
        ) {
          ret = numberFormatter(
            value / multi, -1
          ) + numericSymbols[i];
        }
      } else {
        ret = numberFormatter(value, -1);
      }
    }

      if (typeof ret === 'undefined') {
        if (Math.abs(value) >= 10000) { // add thousands separators
          ret = numberFormatter(value, -1);
        } else { // small numbers
          ret = numberFormatter(value, -1, void 0, ''); // #2466
        }
      }

      return ret;
    }
  }
Highcharts.merge(true, options, {
  yAxis: {
    labels: {
      formatter: function () {
        // Preserve any format changes
        var label = options.yAxis.labels.format
        var m = label.match(/(?<prefix>.*){text}(?<suffix>.*)/)
        if (m) {
          var [_match, prefix, suffix] = m
          return (prefix || "") + defaultLabelFormatter.call(this) + (suffix || "")
        }
        return defaultLabelFormatter.call(this)
      }
    }
  }
})
Here is a link to a full screen view where this custom code is applied.
If there is enough interest to do so, we might change this behavior in the future. So do let us know what you think!
edit Q4 2023: prevent 0s being shown