The everviz application does not currently support grouped categories, however, all hope is not lost; the following image is the output of an everviz chart rendered in a JSFiddle:
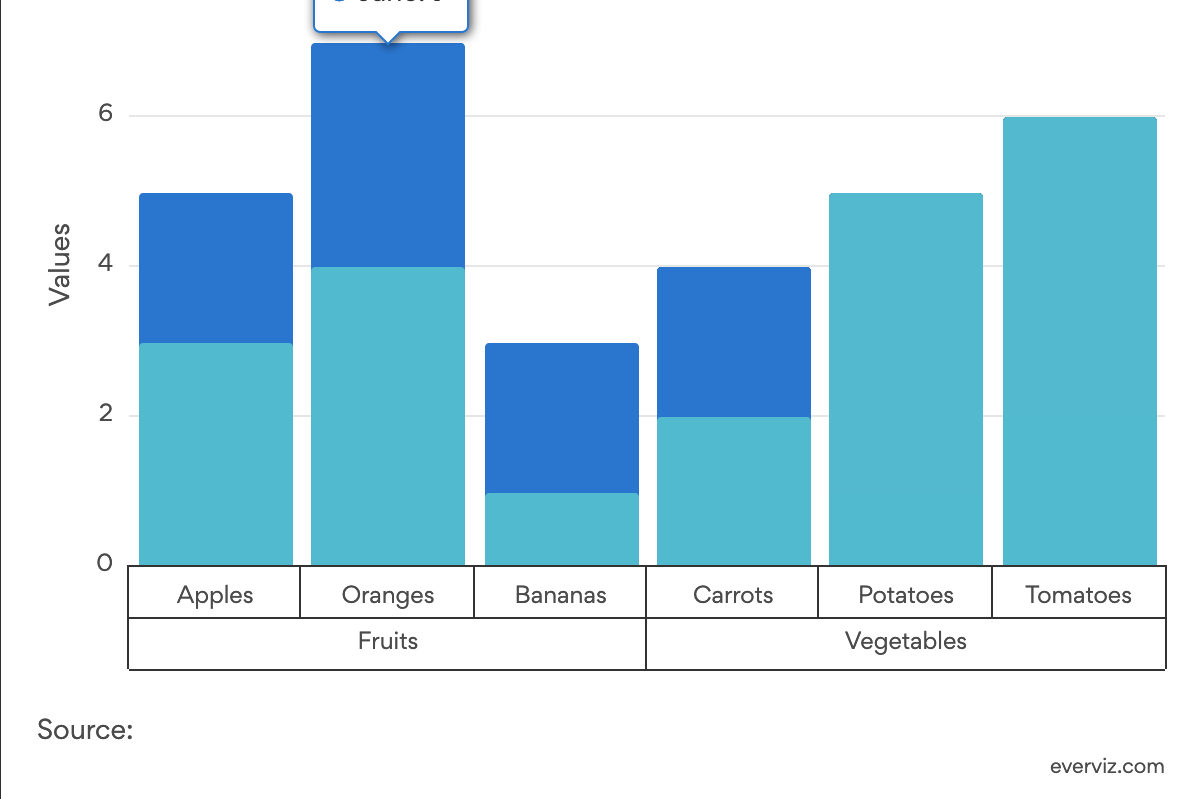
The chart can be viewed and cloned from here:
https://app.everviz.com/create?uuid=_ElHzqTi5/?v=18
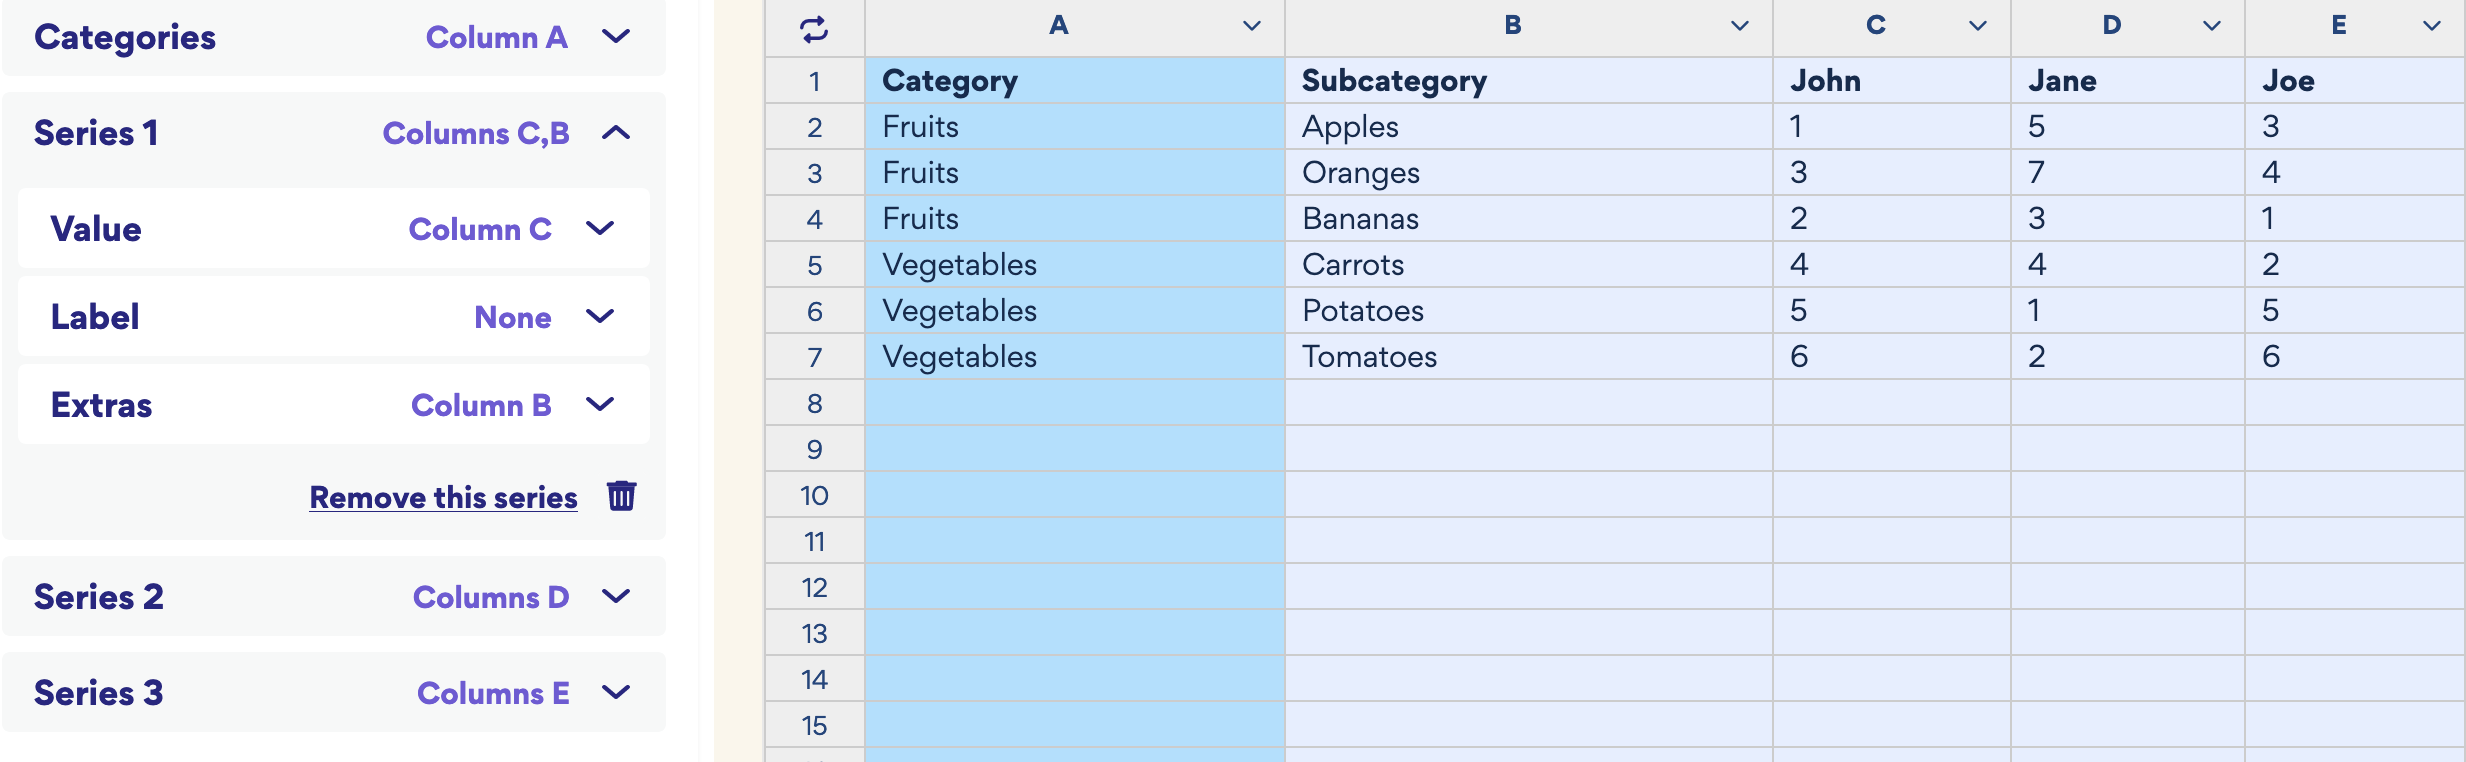
What makes the grouped categories possible is some custom code that inspects the data sheet for the chart, and converts it to the structure that is expected to make grouped categories work, accordingly, the data sheet looks like this:
As seen in the JSFiddle, it is currently necessary to load this HTML before your chart:
<script src="https://cdnjs.cloudflare.com/ajax/libs/PapaParse/5.4.1/papaparse.min.js" integrity="sha512-dfX5uYVXzyU8+KHqj8bjo7UkOdg18PaOtpa48djpNbZHwExddghZ+ZmzWT06R5v6NSk3ZUfsH6FNEDepLx9hPQ==" crossorigin="anonymous" referrerpolicy="no-referrer"></script>

<script src="https://code.highcharts.com/highcharts.js"></script>
<script src="https://blacklabel.github.io/grouped_categories/grouped-categories.js"></script>
Where the first script loads a CSV reader, the second reloads Highcharts, such that we can successfully load the grouped categories module.