The everviz application does not currently support drilldown charts, however, all hope is not lost; the following recording is the output of an everviz chart with drilldown enabled, rendered in a JSFiddle
you may notice in the video that the chart appears to animate twice, I have identified a fix for that, but not written it yet
The functionality is implemented with a piece of custom code, which can be viewed and cloned from the reuse link below
https://app.everviz.com/create?uuid=waTqVuO9p
The underlying data structure which makes this all possible is seen below
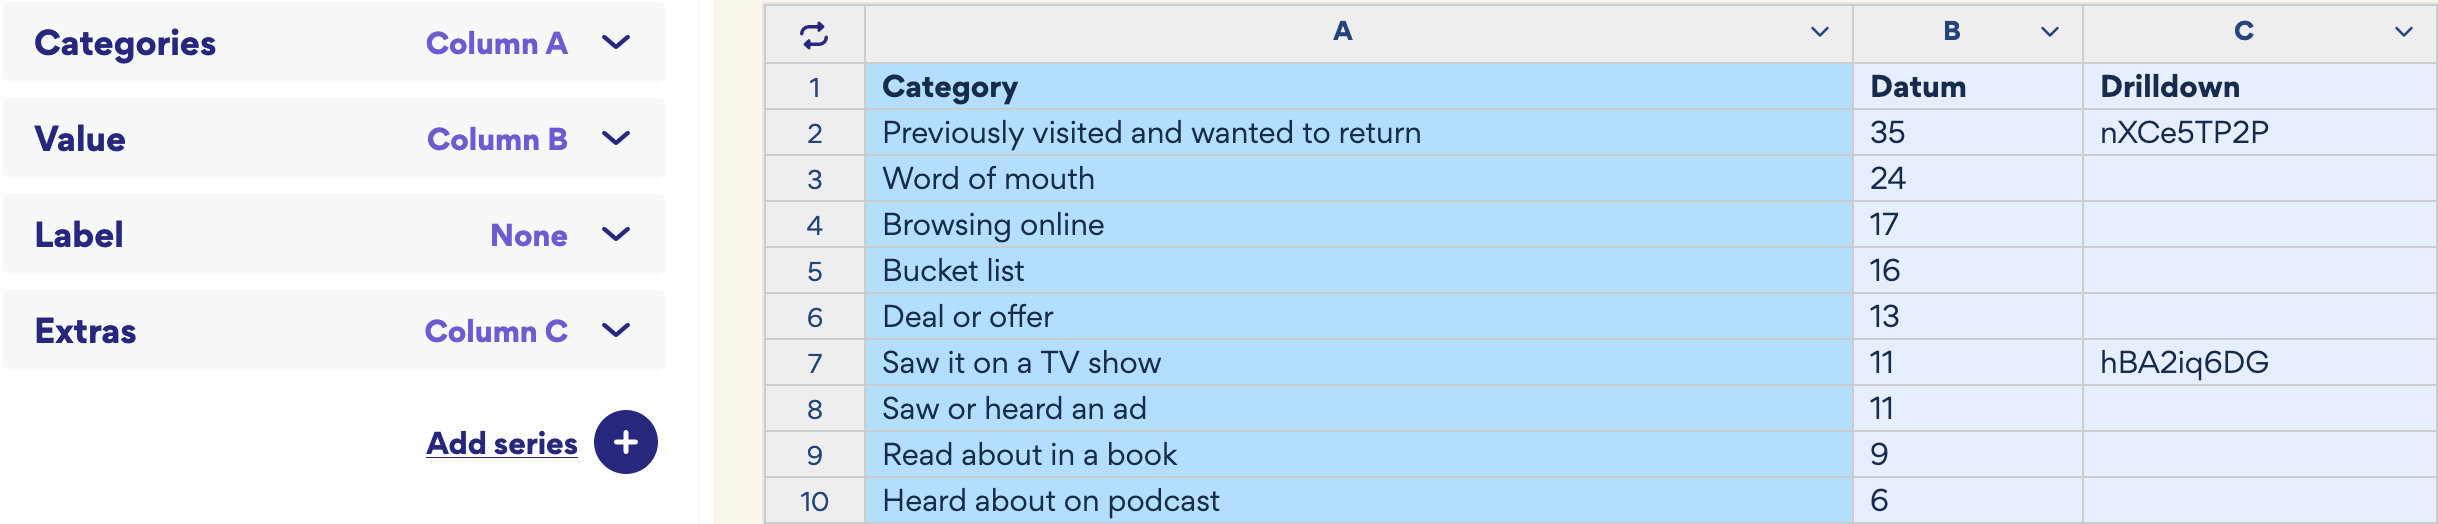
Where the text for the Drilldown column is a the ID to a specific chart you would like to be opened once the point for that drilldown is clicked. For example, hBA2iq6DG will be the chart:
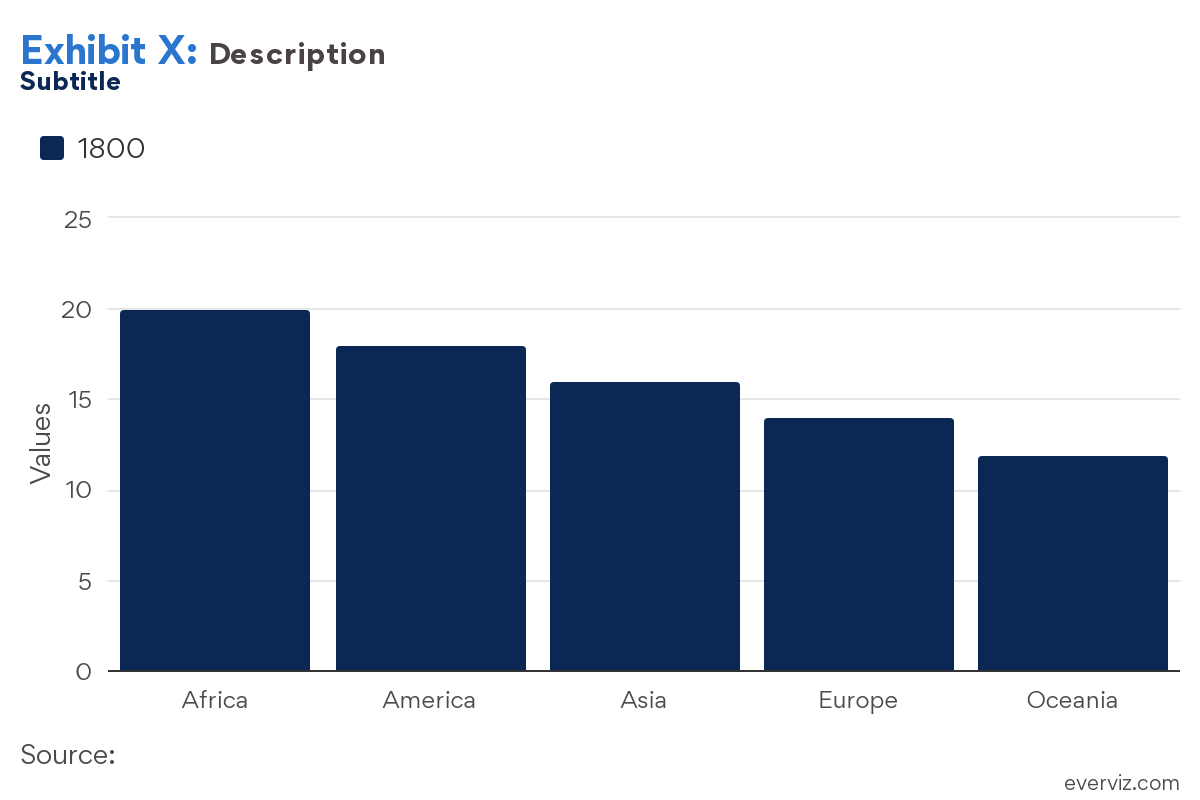
at https://app.everviz.com/embed/hBA2iq6DG
While I haven’t tested this in detail. From the pie chart demo in the above fiddle I noticed that it is possible to drilldown an arbitrary amount of levels, hinting that it is possible to extend this to generally work with any amount of drilldown levels.
As seen in the JSFiddle, it is currently necessary to load this HTML before your chart:
<script src="https://cdnjs.cloudflare.com/ajax/libs/PapaParse/5.4.1/papaparse.min.js" integrity="sha512-dfX5uYVXzyU8+KHqj8bjo7UkOdg18PaOtpa48djpNbZHwExddghZ+ZmzWT06R5v6NSk3ZUfsH6FNEDepLx9hPQ==" crossorigin="anonymous" referrerpolicy="no-referrer"></script>

<script src="https://code.highcharts.com/highcharts.js"></script>
<script src="https://code.highcharts.com/modules/drilldown.js"></script>
Where the first loads a CSV reader, the second reloads Highcharts, such that we can successfully load the drilldown module.