Charts using categories normally reserve space on their edges:
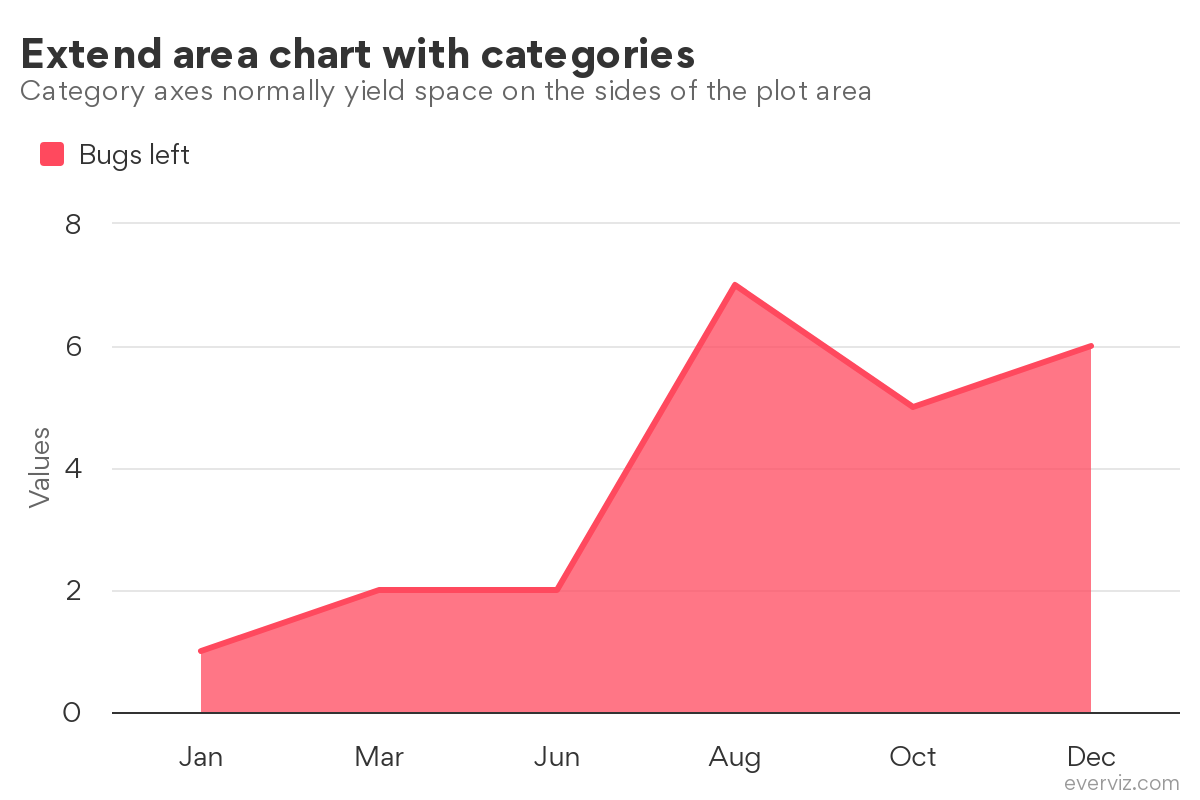
You can override this with a little bit of trickery. The next chart will have the following custom code applied:
if (options && options.data && options.data.csv) {
    var numberOfCategories =  options.data.csv.split('\n').length - 2.49

    Highcharts.merge(true, options, {
      xAxis: {
        min: 0.49,
        max: numberOfCategories
    }
  })
}
But numberOfCategories is only the number of points you have. So this can be done in the editor, if you’re willing to count. In that case, you must subtract 1.49, because in this case we need to exclude the header row.