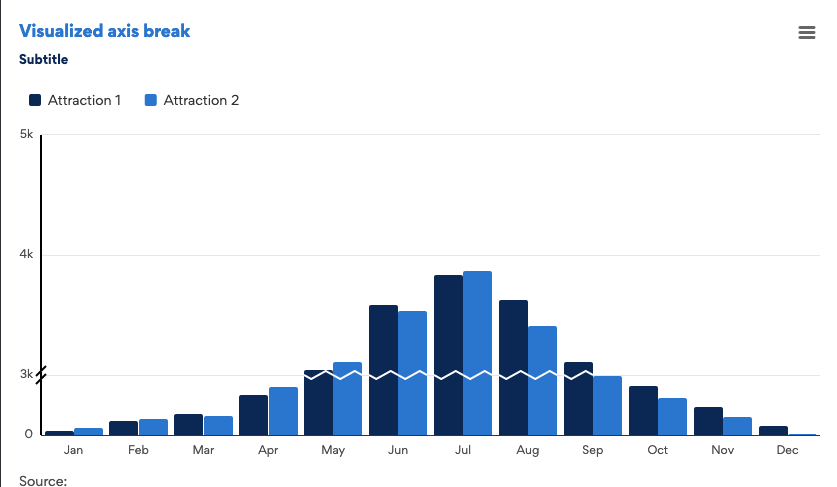
The everviz application does not currently support axis breaks, however, all hope is not lost; the following image is the output of an everviz chart with axis break enabled, rendered in a JSFiddle:
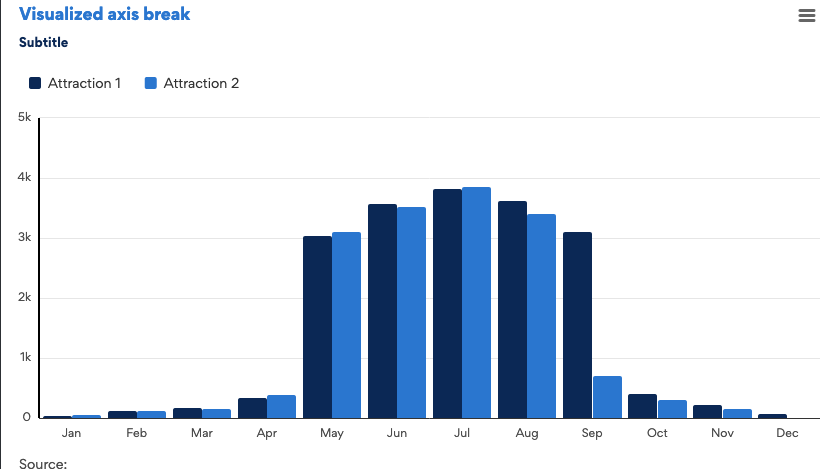
And to follow is the same chart, this time with axis breaks disabled:
Notice how values less than 500 are shown as normal, but the chart’s vertical axis immediately jumps to 3 000, before things follow from the normal flow again. The result of this is that the value distribution of the rendered chart is much more uniform.
Check out and clone the project here:
Be mindful that the functionality is set up with custom code, so that is where you need to look to get started.
As seen in the JSFiddle, it is currently necessary to load this HTML before your chart:
<script src="https://code.highcharts.com/highcharts.js"></script>
<script src="https://code.highcharts.com/modules/broken-axis.js"></script>
Where the first script reloads Highcharts, such that we can successfully load the drilldown module.