We’ve found being to add Label and Extra data columns and being able to display them in the tooltip incredibly useful for some of our more complex charts, especially for things like maps and bubble charts where extra information other than numerical data like place names, category names etc is essential for understanding the chart.
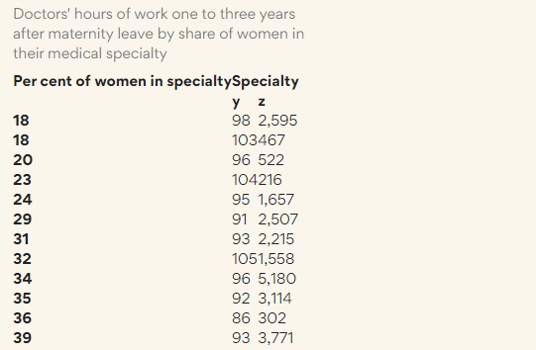
We’ve noticed though then when you download the data from the chart as a CSV file or View Data Table that the Label and Extra series don’t show up there. This means anyone who downloads the data then can’t see key information. Example below shows data by medical specialty, but because it’s a bubble chart you can only see the x, y and z values and not the specialty names (added via a Label column) present in the original data.
Everviz are investigating but thought I’d post here so any updates on this can be shared.