Is it possible to add more than one “series” in a choropleth map? Or at the very least have the “Extras” and “Label” show in the data table?
The issue right now is, we cannot use the “View data table” or “Download XLS” options in our maps because it’s missing the extra points we have added in the Tooltip and is no longer considered the “Accessible version”.
We want to be able to have more than one series in our maps, much like we do a regular column or line chart.
We were able to cheat and add extra data by using the “Extras” and “Label” as series.
This allowed us to have those extra points in the Tooltip, however they don’t show in the data table. Therefore, we couldn’t use the table as an accessible version.
At the very least, it would be great if we could get those “Extras” and “Label” to show in the data table, much like you have for Annotations.
Facing a similar challenge, though without the need to see anything on the data table, only the tooltip.
In short, I need the ability to show multiple data points / stats (a number and a short description), say no less than 5, for each of several points on a world map (using a point map).
@KerryHom: can you share how you “cheated” to show the additional data on your end?
Is there a limit to how many of these can be added?
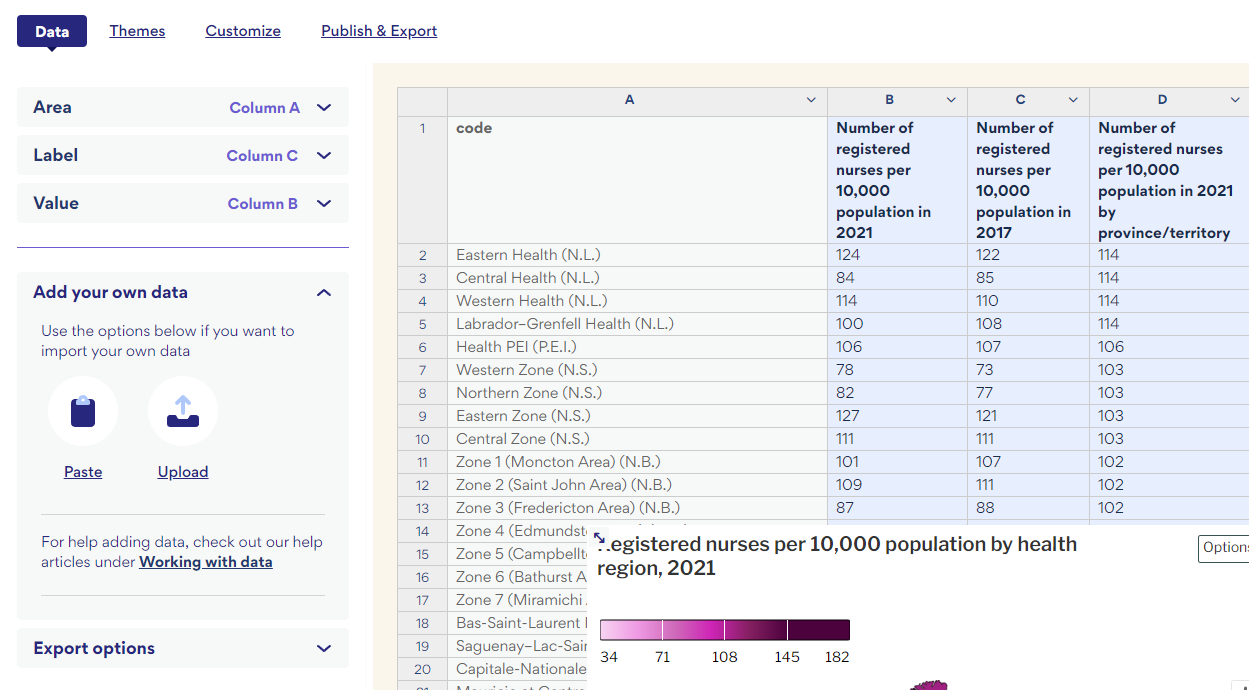
We used the “label” and “extra” choices from the dropdown in the data tab to add extra data. Then we put it in the Tooltip. This allowed us to have 3 data points, {point.value}, {point.label} and {point.extra}.
<b>{point.value}</b> per 10,000 population (vs. <b>{point.label}</b> in 2017) <br>Provincial/territorial rate: <b>{point.extra}</b> per 10,000 population
@kluvin It seems that the “extra” label is still missing as a choice in the data tab. Is this being added back in?