Extra values or turning off a series in my chart

I seem to be stuck on why i can’t add the values in Column D as a series Extra anymore.

Previously, I was able to add values into this column that i could use in my tooltip as {series.extra} to show data from a previous year.

Now for some, reason, I don’t have this option?

Alternatively, can I have this data as Series 2 but then choose to hide the series from my chart?

Hi Chris,

You’re right, the “Extra” label is missing. It’s missing on maps as well. This might need to be reported as an issue.

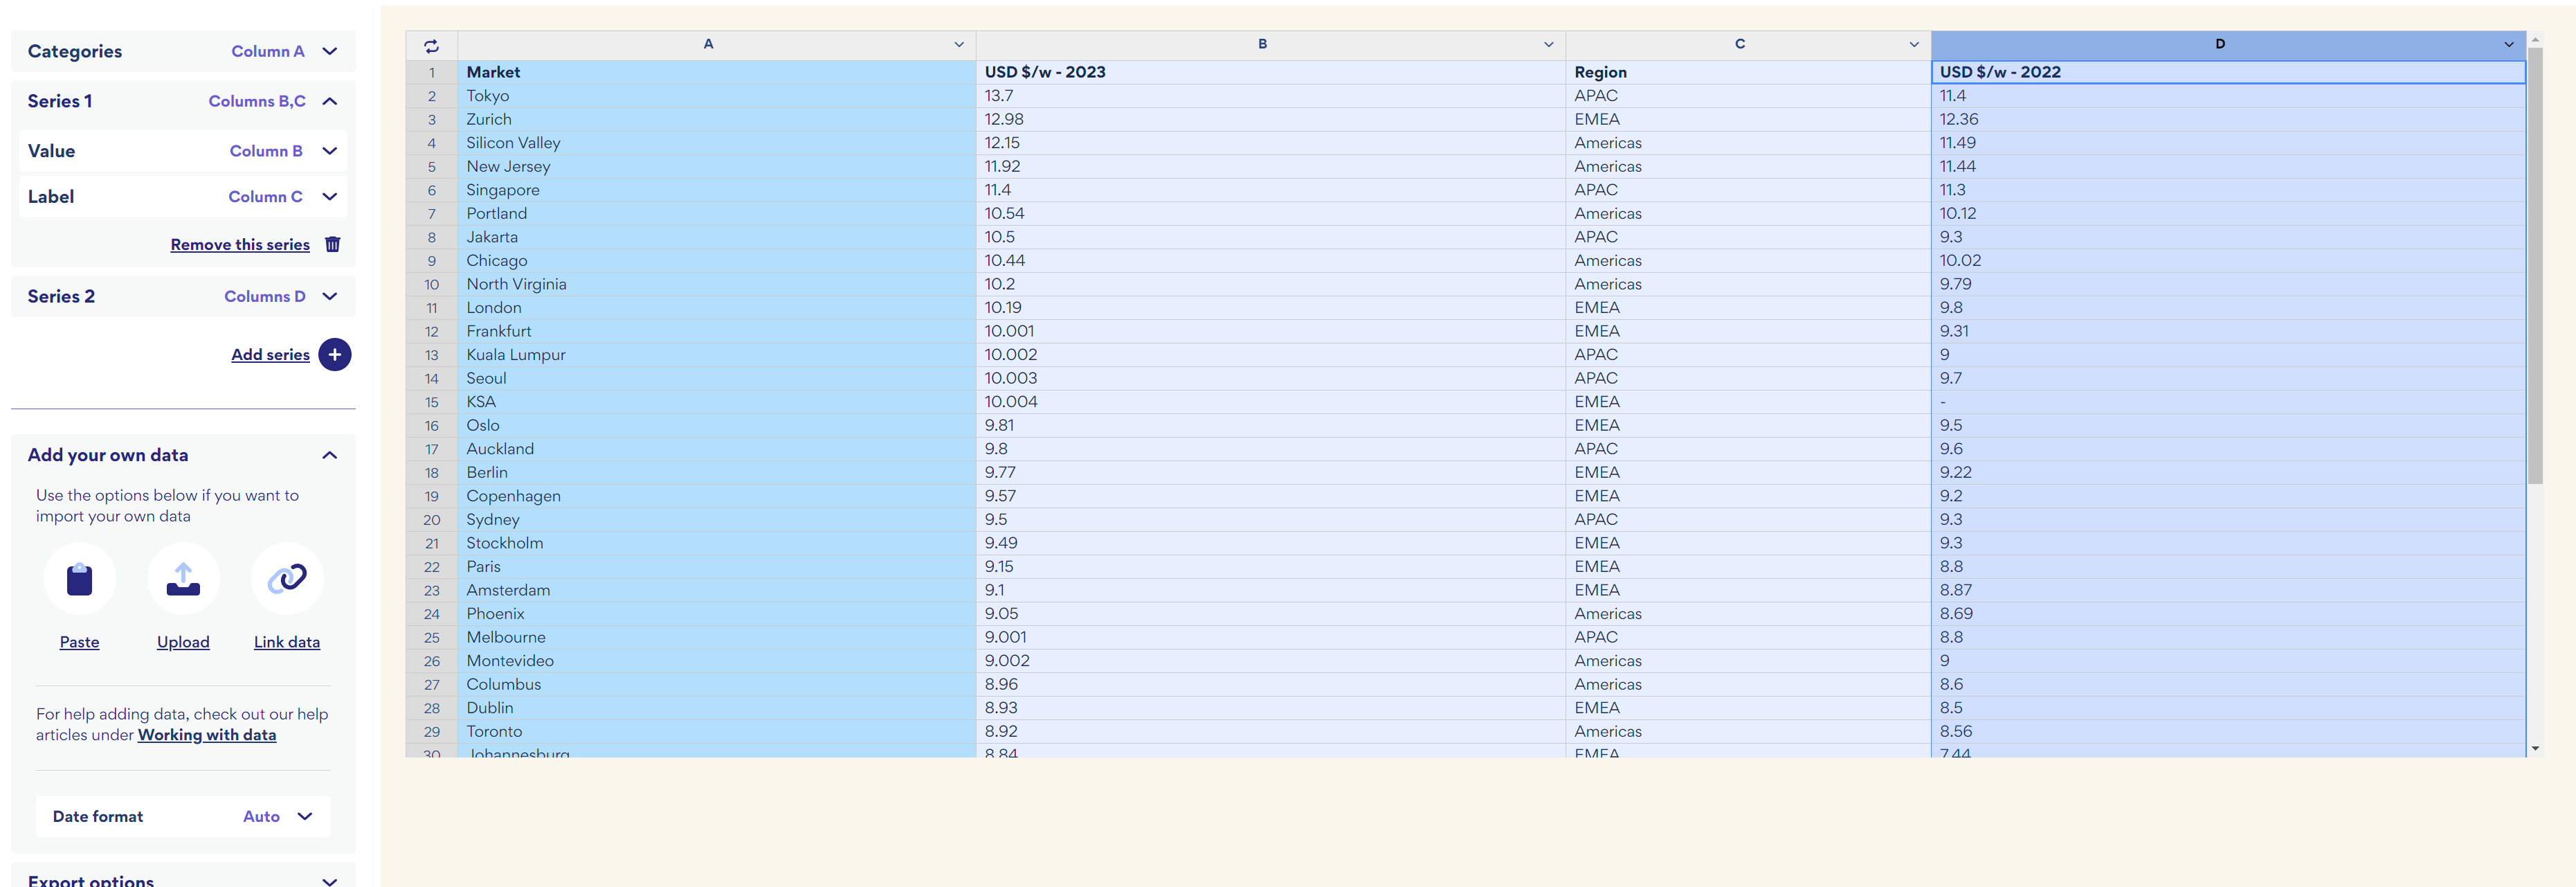
I have done your work around in the past so that, not only do I get the data to show in the tooltip, but it also shows in the data table that’s below the chart.

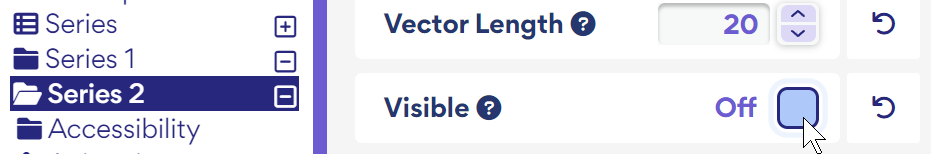
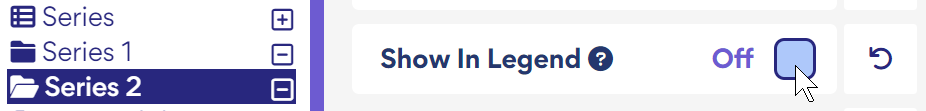
Just uncheck “Visible” in your series. You may also need to turn off the different states (hover, select, etc) too. I’ve had to make sure that my colours were set to transparent so they wouldn’t show.

1 Like

Legend, thank you so much

1 Like

Speaking of “Legend” :slight_smile: , you may need to uncheck Show In Legend as well.

1 Like

@MartinKleiven can this be reported please?

Dutifully done, we greatly appreciate the report!

2 Likes

Hi,
Can we please get an update on when the “Extra” label will be added back in? We use this quite a bit.

Thanks!

Hello Kerry, this looks to be complete now, awaiting release.

I’m working out some yank with the changelog thingy. Sorry!

1 Like