This post we’ll go over the steps for uploading your organization’s logo into everviz and adding it to a chart.
Note: A business or enterprise plan is required to upload your own logo.
Upload a logo
-
Log in and click Customize editor in the left-hand menu
-
Click + under Logo
-
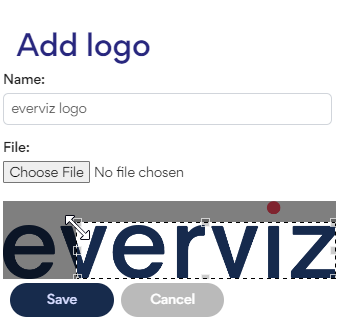
Click Choose File and select the logo as a .jpeg or .png
-
Use the selector tool to select the borders
-
Give the logo a name and click Save
Add a logo to your chart
Note: Logos are currently only visible for the Layout and Tables project types. Add logos to single charts using the single element layout.
- Create a layout project
- Enter the layout editor and select the single element layout
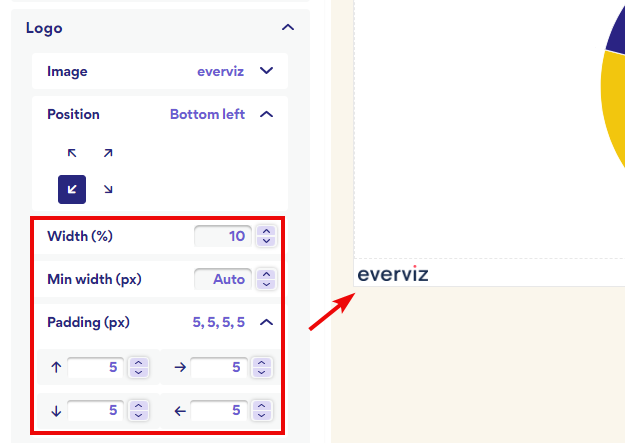
- Under Customize > Logo > Image and select your logo from the dropdown menu
- Change the width percentage to reduce the size and position the logo using the padding controls
Give it a shot!