Disclaimer: This is intended as a conversational piece, and does not reflect that we are doing any internal work on such a feature.
It is possible that we can add a small video file, or side-by side image to the tooltip descriptions of features in Advanced, next to the description. For example, here is the tooltip of Advanced > Plot options > Column > Color by Point would show
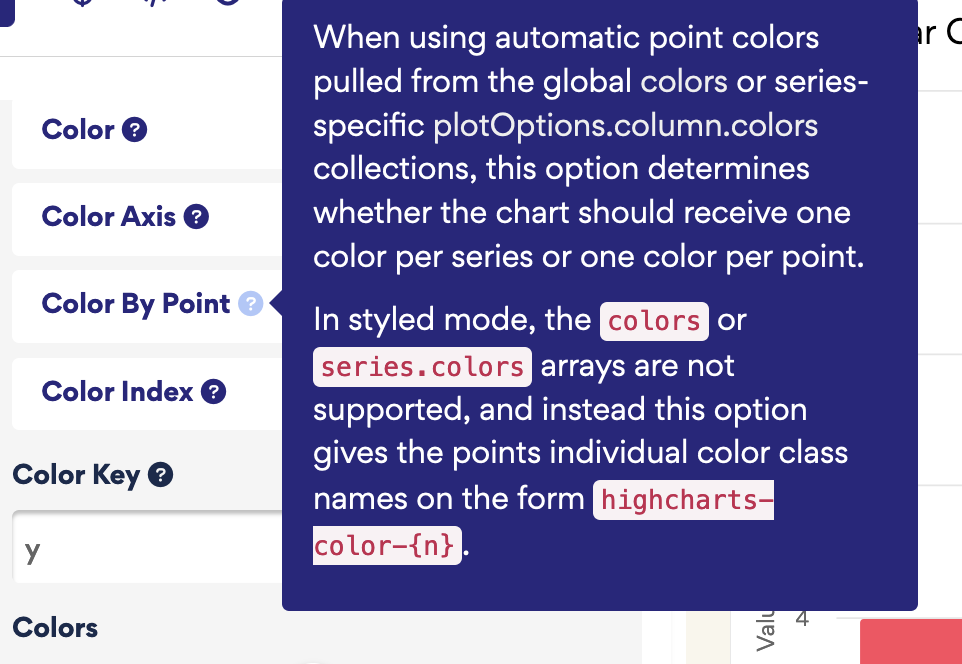
Which might show the following to illustrate its effect:
Note This is a manually recorded video, we would have to produce videos automatically for any potential real feature. Doing so complicates the matter somewhat. We are interested in feedback here nonetheless.
As an aside, we might could also improve the writing of the tooltips to follow a more friendly pattern, where the primary intent of the setting is isolated from any additional explanation:
Primary action: Determine whether the chart should receive one color per series or one color per point
Additional information: Applies point colors pulled from the global colors or series-specific plotOptions.column.colors collections. When this option is set to true, the chart receives one color per point, and when it is set to false, the chart receives one color per series.
This option is not supported in styled mode when using the colors or series.colors arrays. Instead, in styled mode, the points are given individual color class names on the form “highcharts-color-{n}”.
Defaults to false.
- Visual demos seems useful
- Improved descriptions seems useful
- Both seem useful
- Not relevant for me or my team