We really like the way when you hover a data point with a tooltip, the colour of the circle within the tooltip changes to match the series you are looking at. But we’ve noticed that once you edit the formatting of a tooltip, e.g. changing the font, colour of the text, or even just adding a space after the circle, that the circle no longer changes colour and stays black.
Is there a way around this where we can edit the tooltip without losing the colour-changing of the circle? Or is there a way we can re-add this circle and it’s colour-matching ability if we happen to delete it? Thanks very much!
As an addon to this…
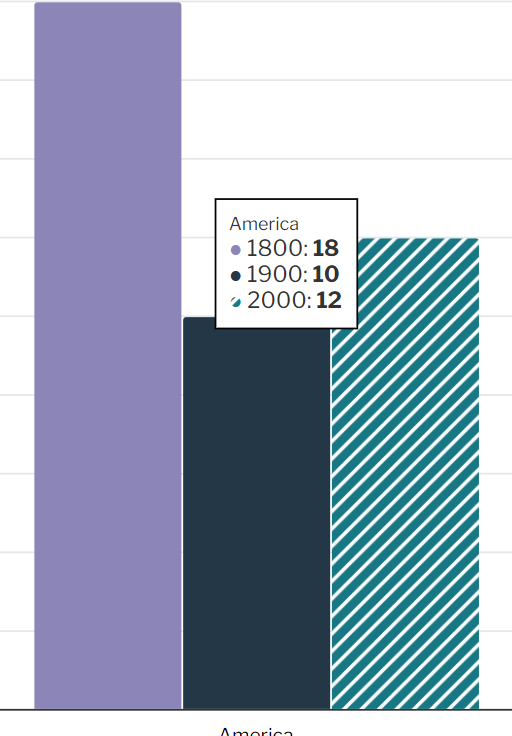
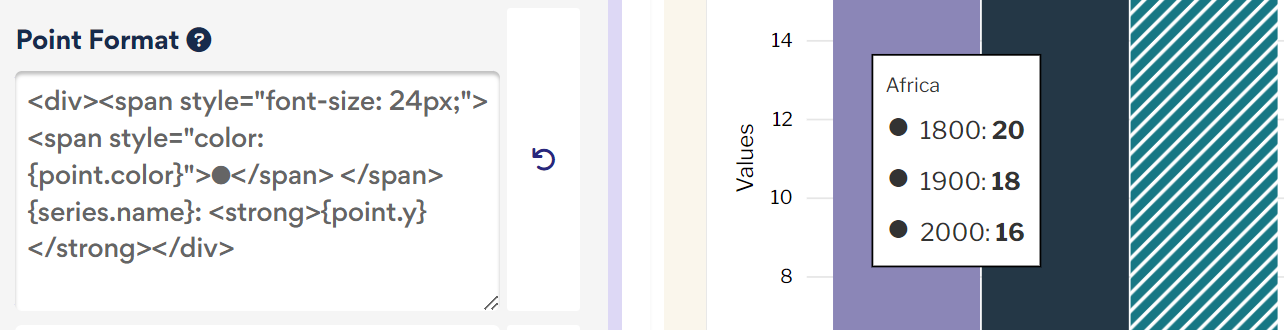
When I add pattern, the tooltip coloured dots come in properly with all of the colours, including the pattern. However, I find the dot quite small and have changed the size to be 24pt in my tooltip settings. Since changing the size, all of the dots change to black.
Not sure. I can follow up when it released. The change applies to modifications done in the rich text editor, which is opened by clicking the pen in the tooltip field, in Basic.
Looks like the value set in Basic options is conflicting with and overriding Advanced, somehow overriding it. Looks like a distinct issue, as per my fix which relates directly to the rich text editor.
Are you changing the tooltip originally set in advanced through Basic?
This is still not working. If you open this chart and hover over the columns with pattern, you can see that the dot shows with a pattern. The minute you try to edit the tooltip under Basic > Tooltip it changes the dots to black.