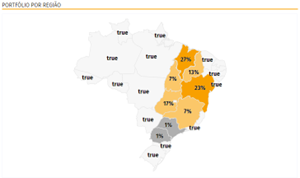
When creating a map chart, please choose the “Basic / Data Labels” option to display the legends showing the percentage of each region on the map. Upon saving, the chart will appear correctly. However, when displaying or embedding the chart, incorrect information for other states is being displayed as true …

Example shared:
https://api.everviz.com/share/-r5AJ6Akq
Anyone can help? Thanks a lot! ![]()