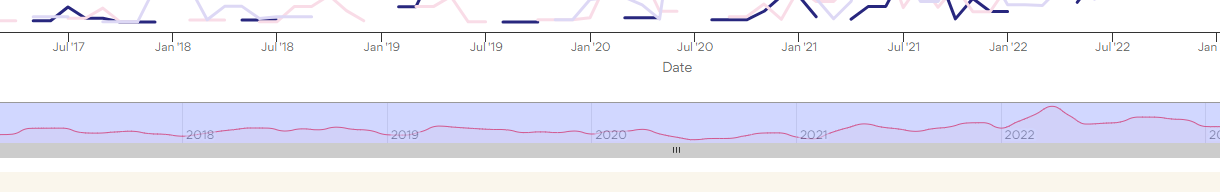
I want to have the customisable timeline that is available in the stock chart as here:
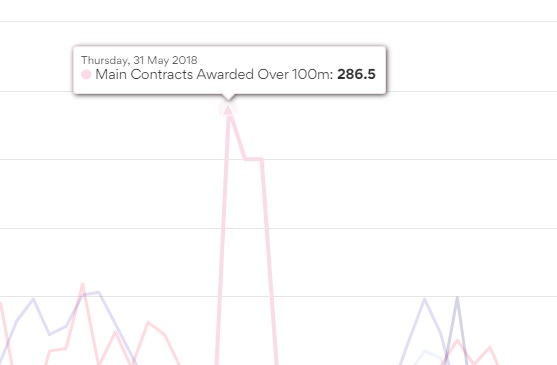
But I want to have the single point tooltip as it appears in the linechart, not with all points in one as it appears on the stock chart.
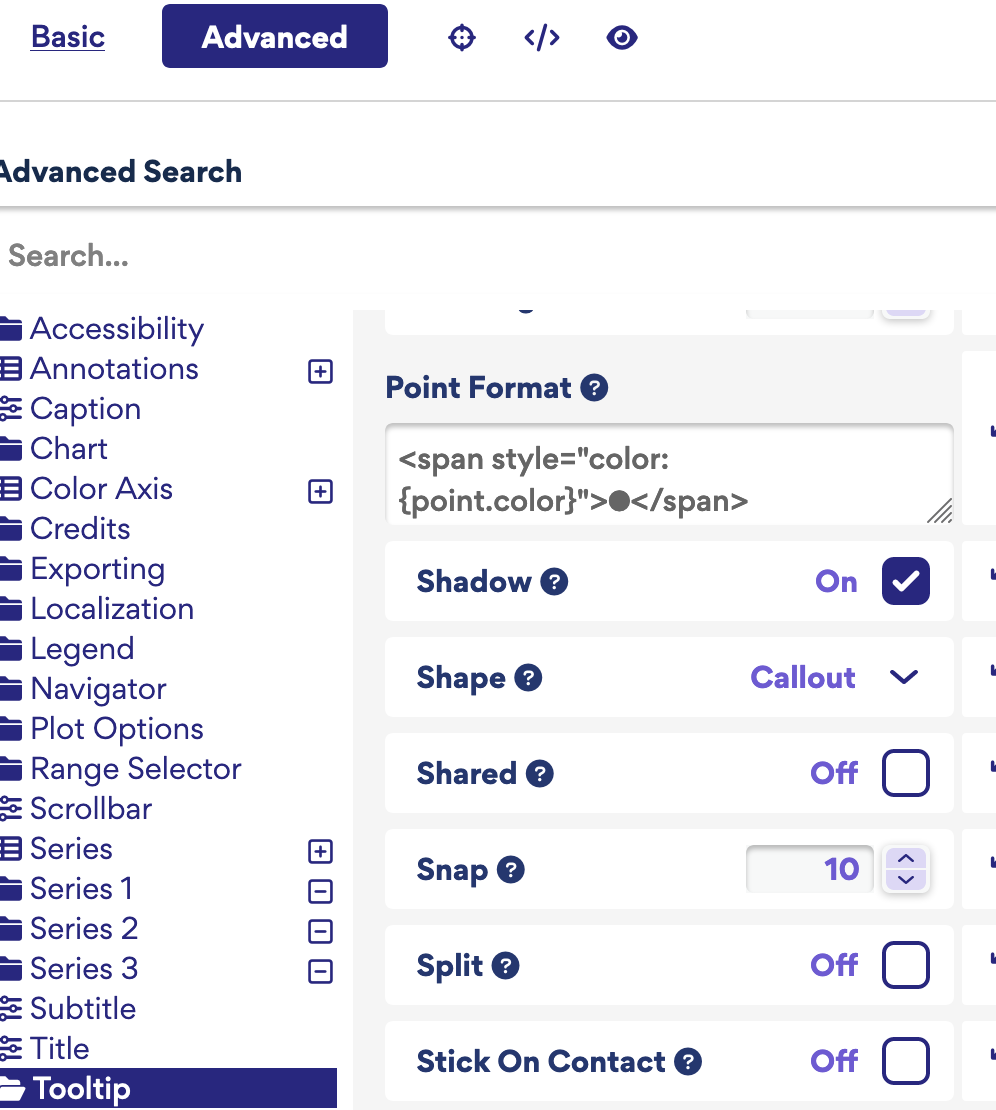
Have tried checking ‘all series’ on and off but doesn’t work. Is it an either/or option in the chart? Or can I import the stock timeline as an extra in the line chart?