Hi,
I would like to be able to show multiple specific data labels on my chart.
The custom code found here allows you to show one data label on a certain value, but I don’t know how to show more than one.
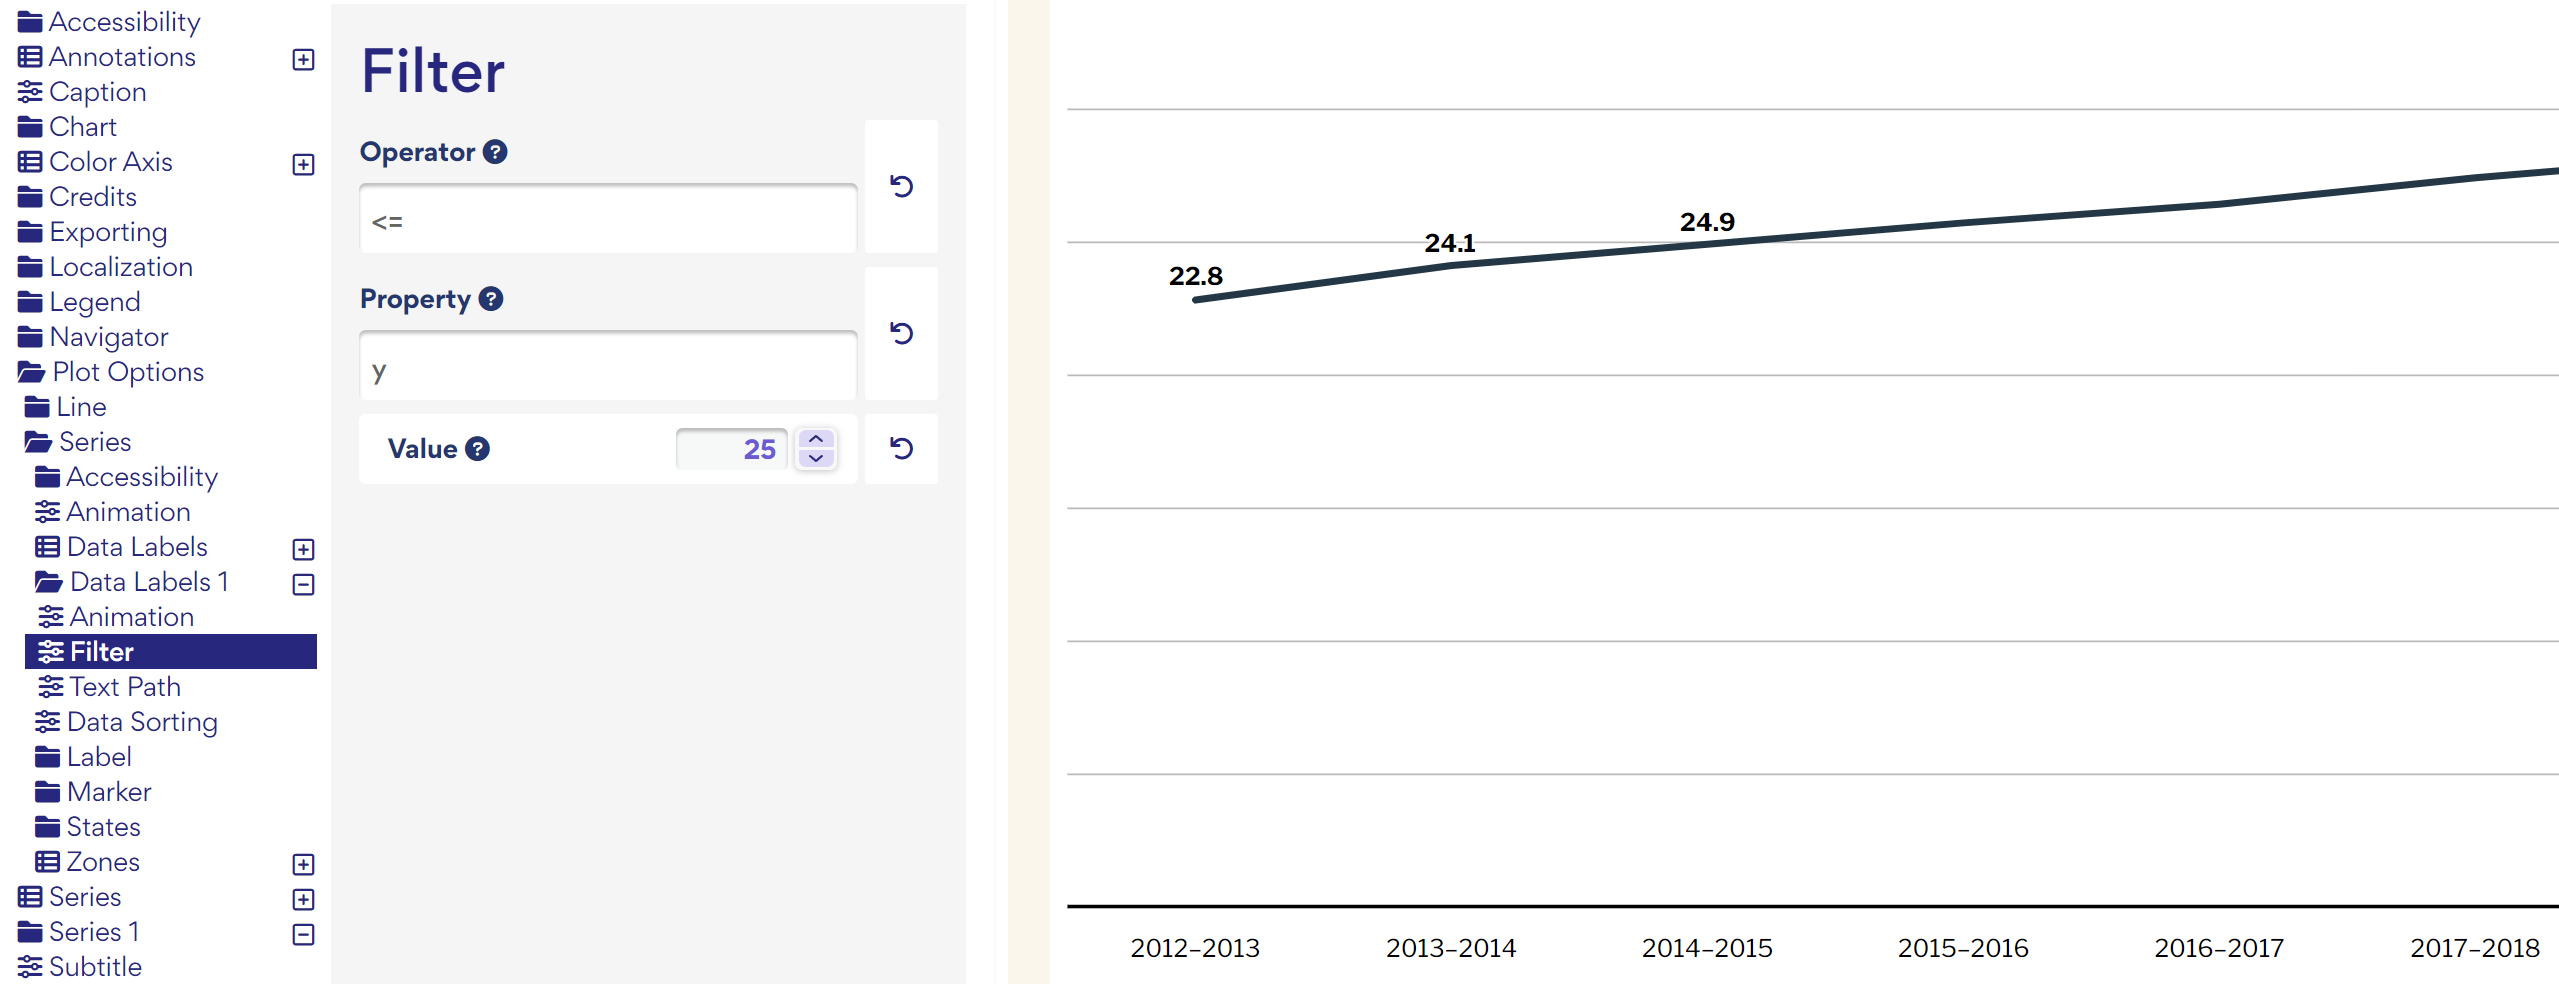
I also know that you can use the filter option within the advanced editor, but I want to be able to pick which data labels show and they don’t necessarily fall within the <> and = filters.
Any help would be appreciated.
Thanks!
kluvin
November 7, 2023, 9:25am
2
You can use a bunch of operators: “>”, “<”, “>=”, “<=”, “==”, “===”
Or modify:
var n = [2, 3]
Highcharts.merge(true, options, {
  // Show specific value
  plotOptions: {
    series: {
      dataLabels: {
        enabled: true,
        format: undefined,
        formatter: function () {
          if (n.includes(this.x)) {
            return this.y
          }
        }
      }
    }
  }
})
1 Like
Than you Martin. This code is exactly what I was looking for
1 Like
Do I need to do something different when using Date Time?
I wanted to show data labels for 2013 and 2022.
var n = [1356998400000, 1640995200000]
Highcharts.merge(true, options, {
  // Show specific value
  plotOptions: {
    series: {
      dataLabels: {
        enabled: true,
        format: undefined,
        formatter: function () {
          if (n.includes(this.x)) {
            return this.y
          }
        }
      }
    }
  }
});
It worked using the above code. I just needed to clear the filter options.
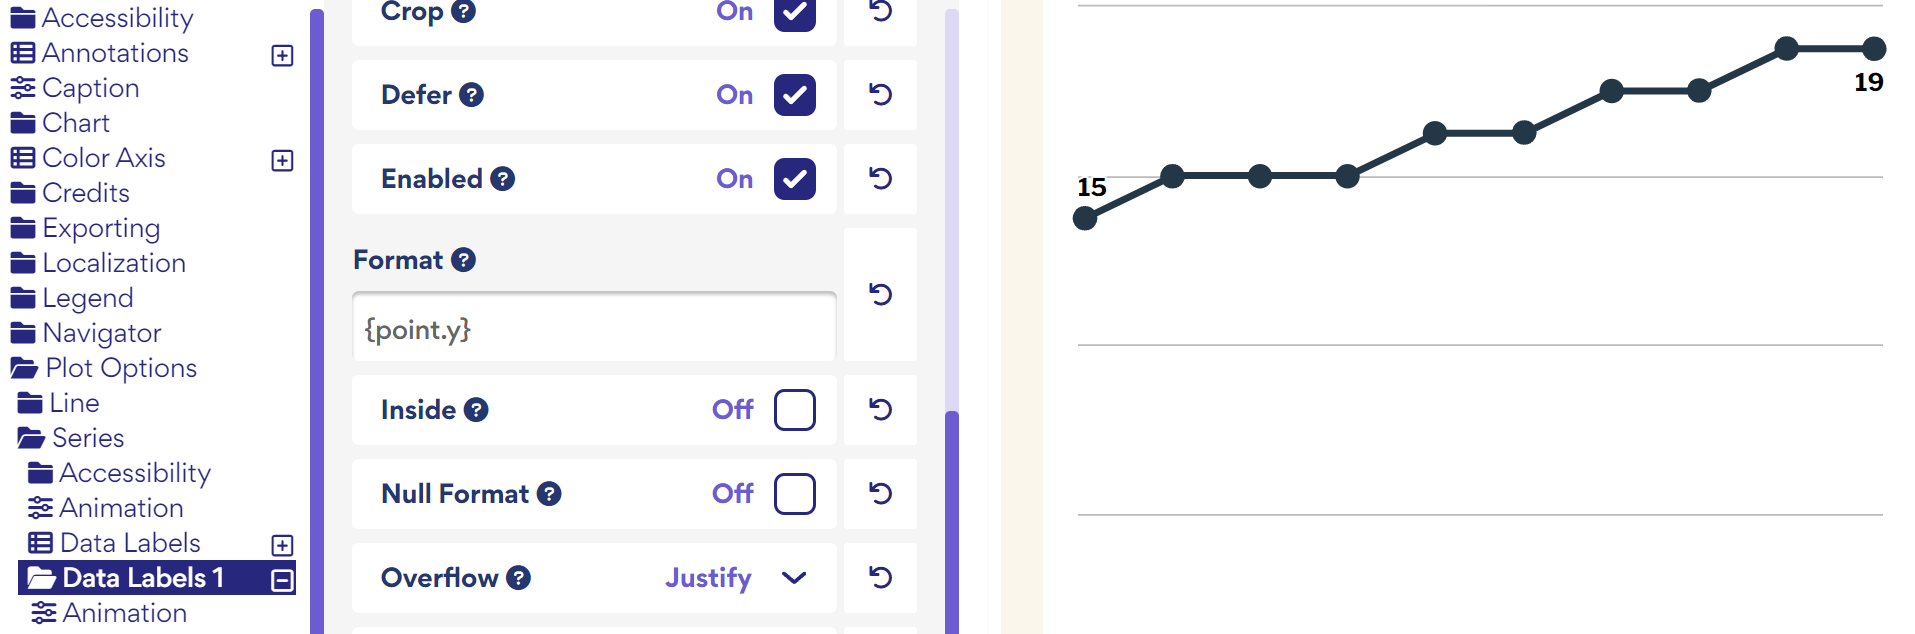
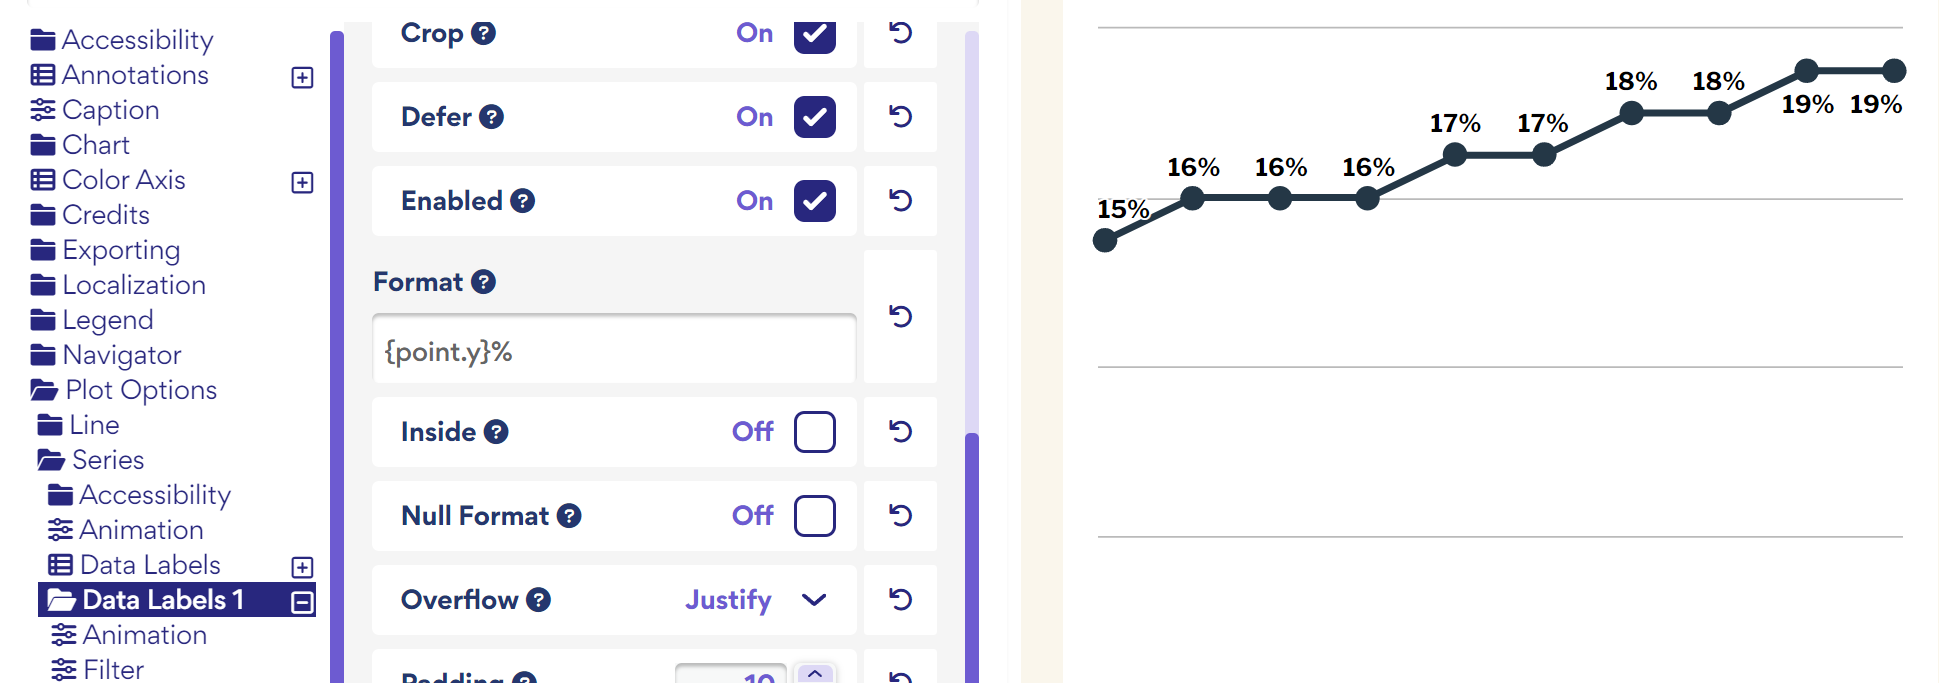
But when I try to add a % after the number, whether it be in the code or directly under “Data Labels 1”, all of the numbers show up.
I can’t supply the public link because the data hasn’t been released yet.
Just wondering if anyone can help me with adding the percentage symbol to specific data labels.
havard
June 27, 2024, 10:59am
7
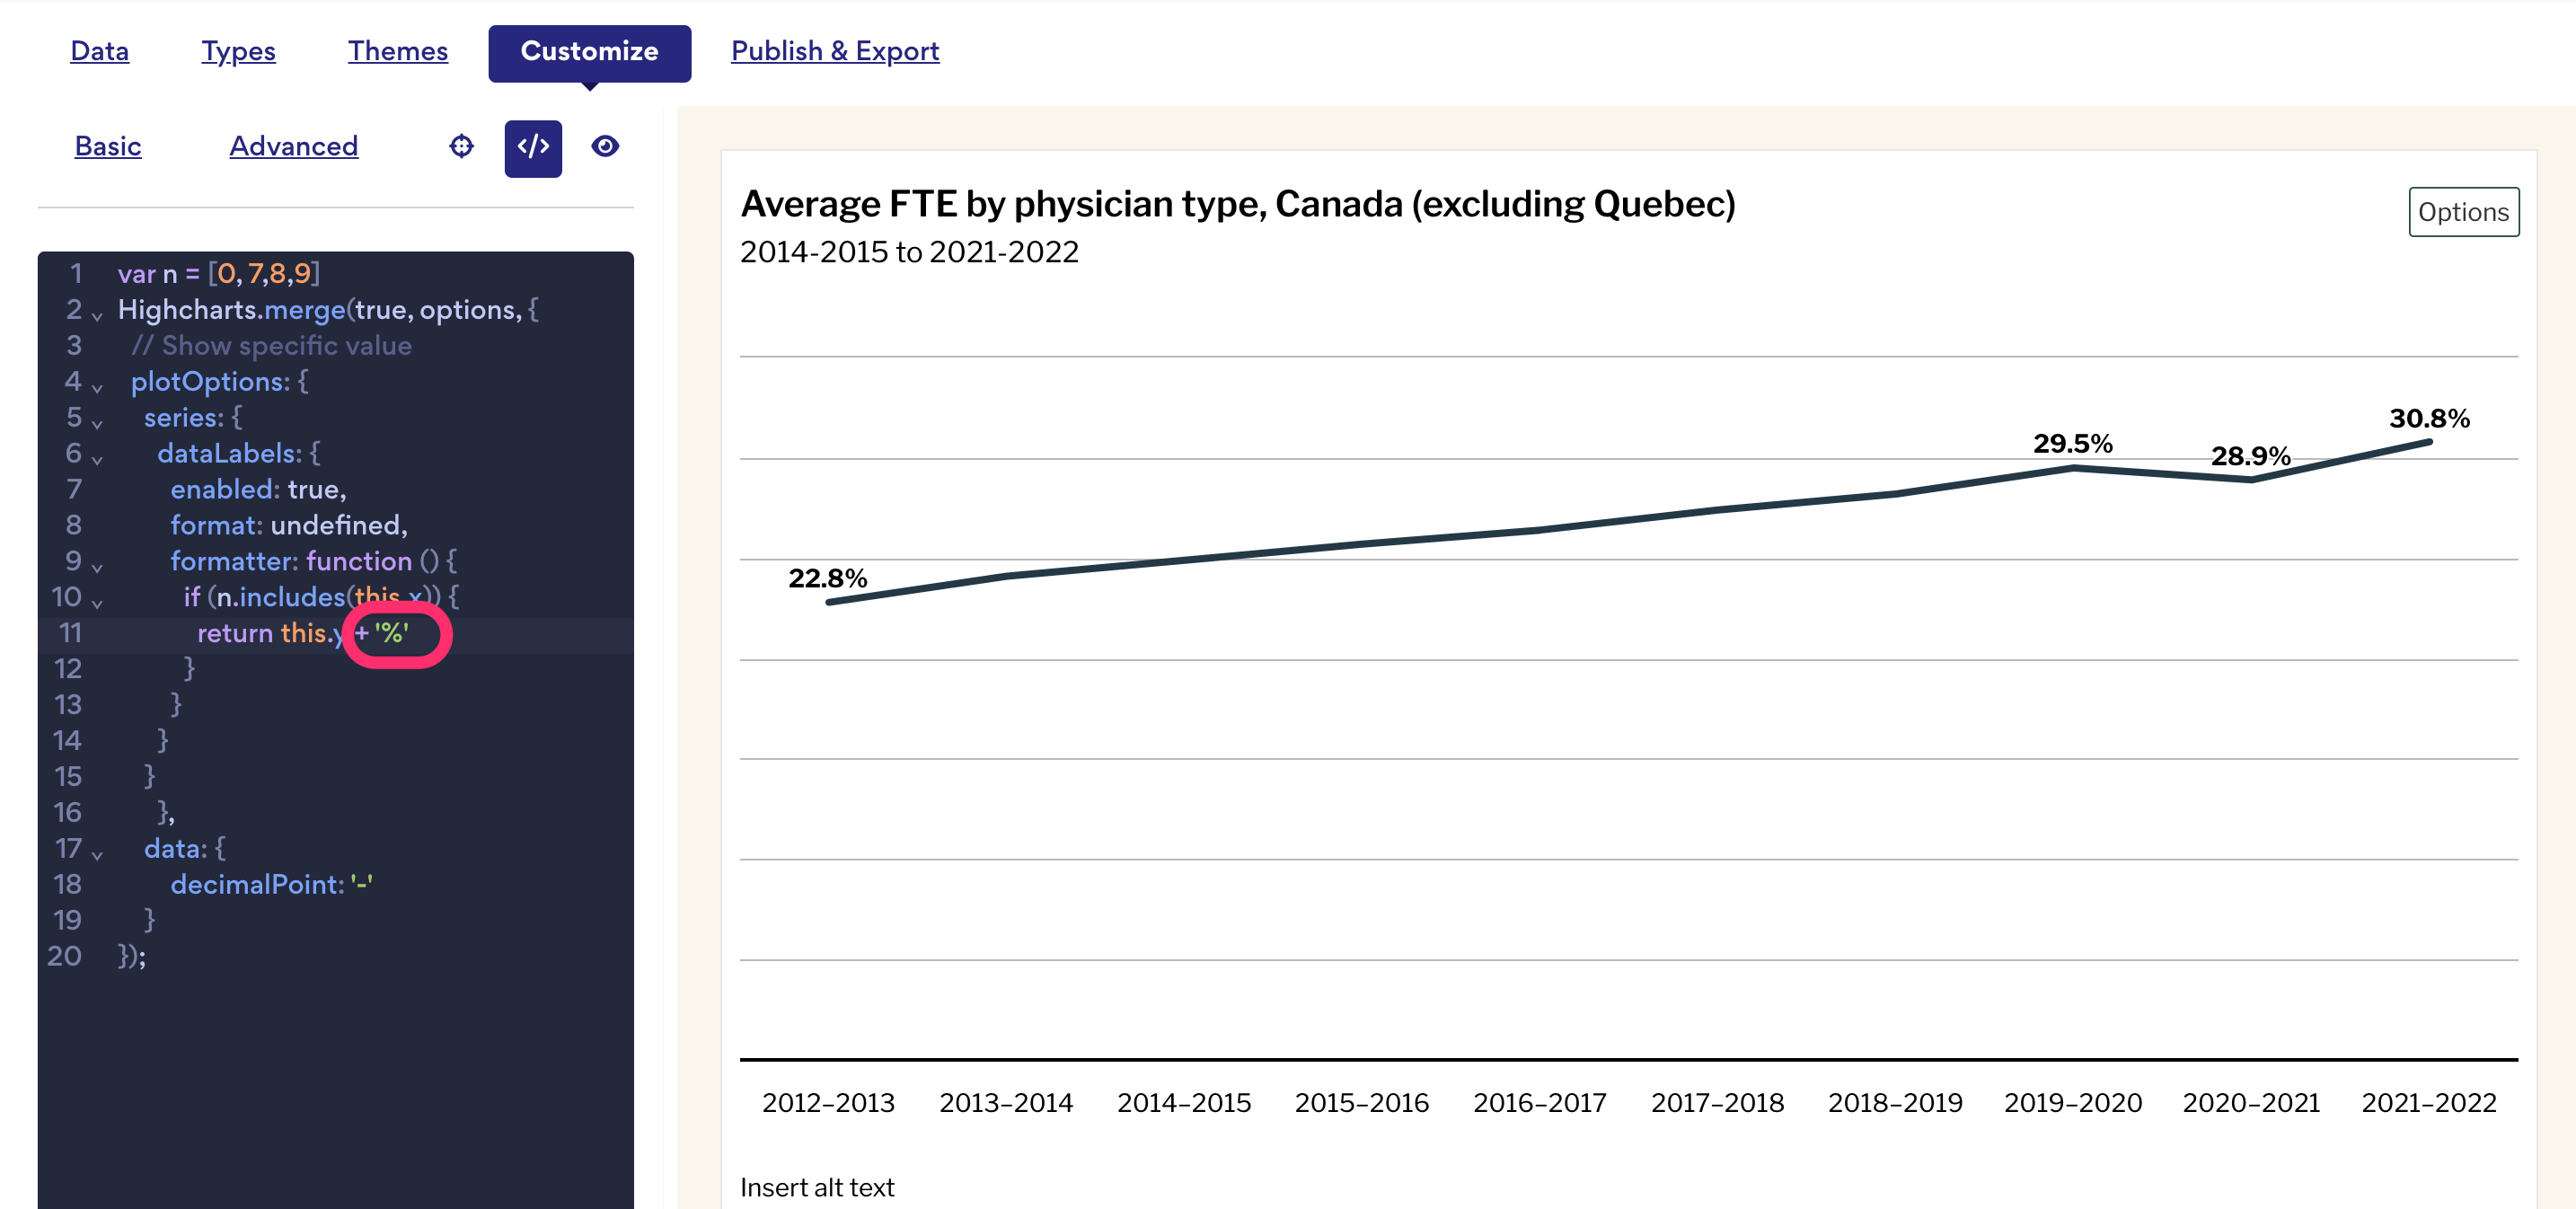
Hi Kerry. I see you have some custom code in that chart.
You can add the percentage sign to your formatter by adding + ‘%’. See screenshot
Cheers,
1 Like