Get help and find solutions through the community.
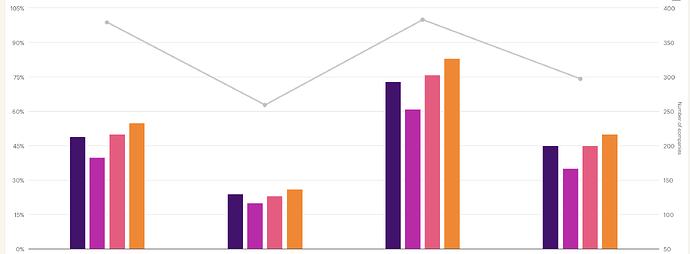
I want to know if I can create 2 or more tooltip body because I have 2 datas in the chart. 1 percentage and 1 without.
I want to show the percent sign in the tooltip but it’s also showing on the data without a percent sign
Hi Micah,
Nice to see you here.
You can add another line of data to the tooltip using the ‘Extra’ functionality in the data grid. Here is a help article explaining the process.
And here is how you add a percentage sign to the value in the tooltip.
Good luck and reach out if you still need help.
Greetings,
Mark
Sorry for the confusion regarding my question. But I want the tooltip on the bar chart to have a (%) sign but the line chart should remain without a (%) sign
OK. So, I am trying to make a map, from a survey. Some states got no votes, but I can’t get the axis type to do anything. I click it, nothing happens. I save, nothing happens. I NEED TO MAKE MY MAP A LINEAR THINGY MAJIGGY
