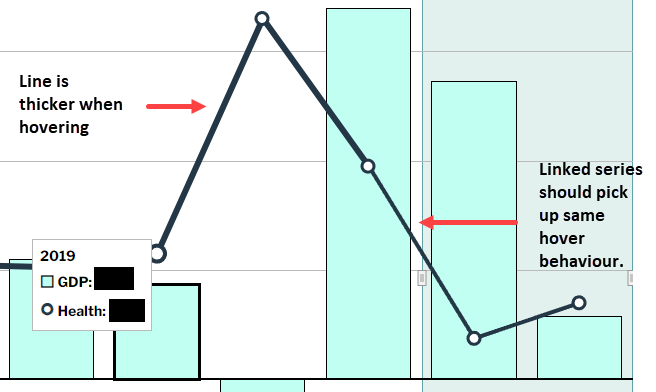
When you hover over a line that has multiple series linked to each other, ALL width of lines within the linked series should increase.
Actual behavior
When you hover over a line that has multiple series linked to each other, only the line of series that you are hovering over increases in width. The linked line doesn’t change at all.
Can I ask why you are building the chart this way? I assume there is a specific reason Obviously this issue can be mitigated by having only one series in the data grid.
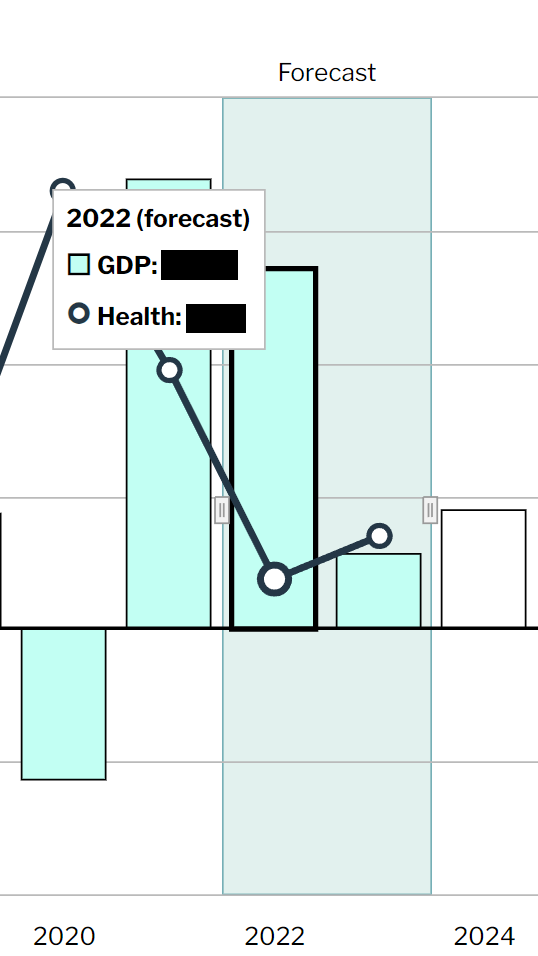
We have created the chart this way because there are actually 2 series here. The first one is GDP and the second was is the GDP forecast. So, there are 2 different tooltips.
I have had to create a third series called “Link”. This is the line that links the first and second series together. Otherwise there is a break in the line.
Thanks for trying some things out. It looks like you got rid of the “Link” and the third series. I need those because I have 2 different series and they need to be linked together.
Maybe this would be best explained in our next meeting?