Sankey charts are amazing for showing a data flow though multiple stages.
The thickness of the bars in a sankey chart is determined by the value assigned to the weight of the chart. Here, A has a thin connection E to and a much thicker connection to D.
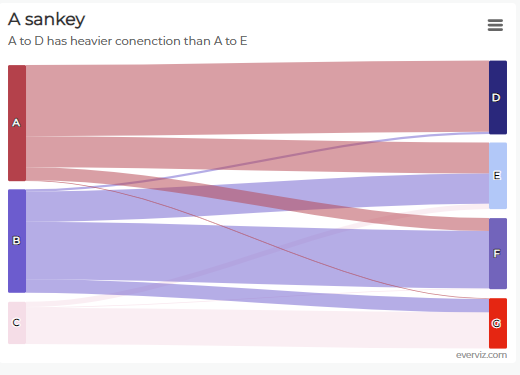
We can change the weight of the line connecting A to D. Notice when we change the value - by adding a larger value in column C Series 1 (weight) - the bar thickness changes accordingly.
Learn more about creating a sankey chart here.