Hello, when I paste in new data to a chart it has started adding a lot of ‘null’ columns that then get added as series. I have to then manually delete each new series to get to the number of series I originally had. Do you know why this is / if there is a fix?
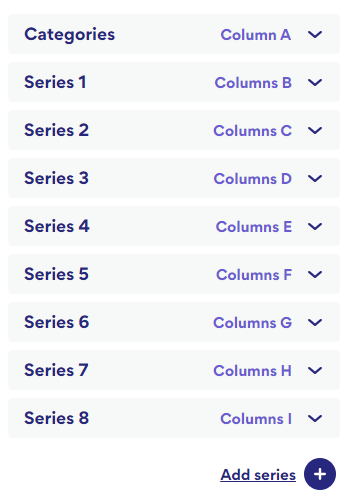
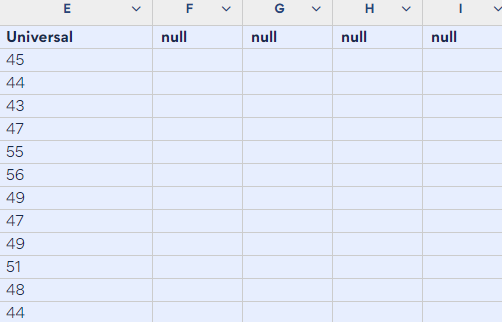
I’ve tried to replicate this in a new chart and haven’t been able to, it instead came up when updating the data in charts from last December (here’s a duplicate of one of them as an example: https://app.everviz.com/edit/511453?editor&panel=chart_data). I think it’s because the columns have null at the header, which once new data is added then get added as new series. I wouldn’t have added in the null headers but maybe these appeared previously? I can bypass this though by making sure to delete these null headers before including new data from now on.