I’m using the Line Annotations (not Highlights, since I don’t want the line to extend the entire width of the plot area) and I’m having trouble making them straight. Is there a way to ensure you’re drawing straight lines?
1 Like
I would also be keen to know if anyone has any solution as I’ve tried to do this multiple time and failed.
![]()
Personally, I find adding line annotations don’t always work the way I want them to, or at all for that matter. They disappear on me half the time and the changes I make to them don’t seem to do anything, or do things I don’t want them to do.
So, if anyone else has any tips using line annotations, I would love to know as well ![]()
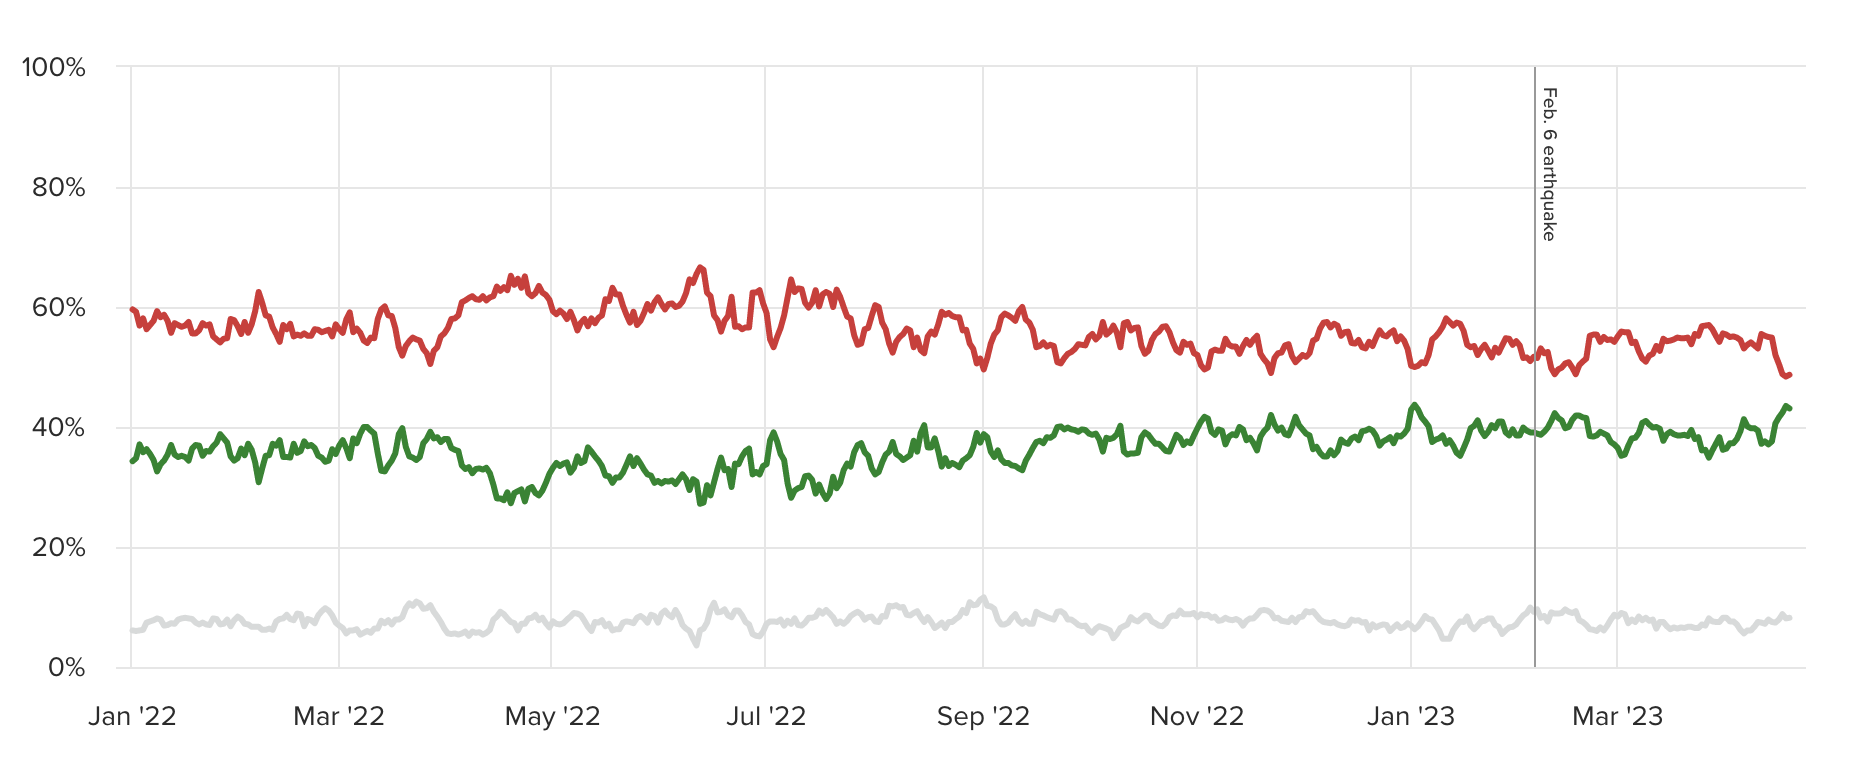
We try to only use the Highlight annotations since we’ve had the best luck with their behavior. They’re limited in what they can do, but we’ve been able to use them to call out specific events/markers on a line chart (screenshot)
1 Like
Obviously we should do a better job with annotations, and with that out of the way, you can force the annotation to fit between two points.
Insert any annotation line:
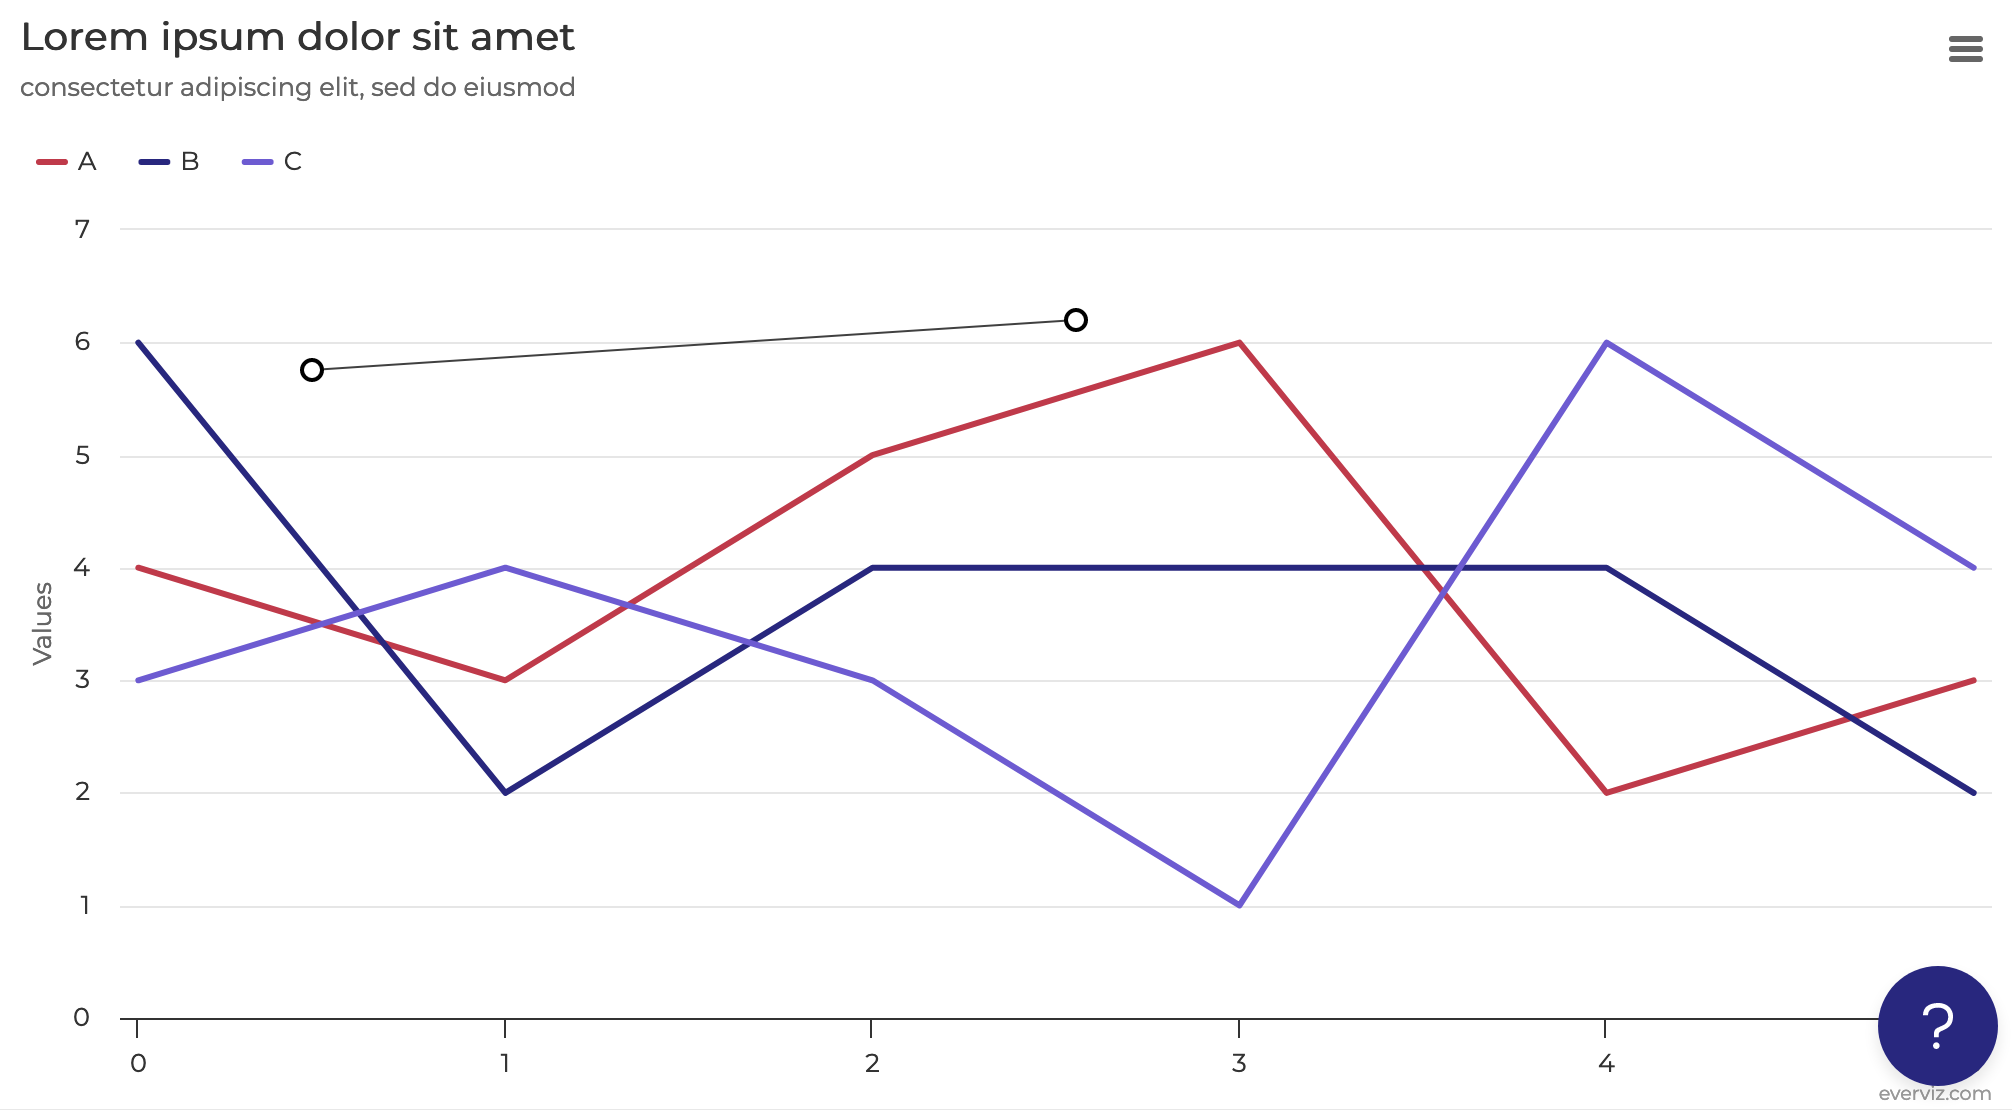
Observe that preview options show some interesting stuff:
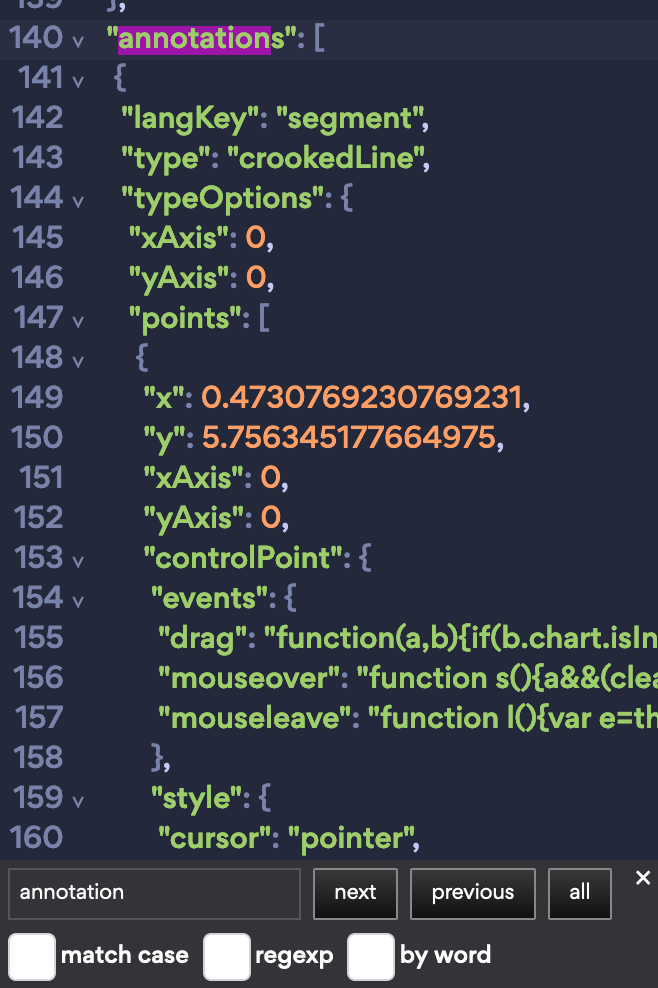
A line is defined by two points, and we’re looking at one of them. We can write write some custom code to set our own X and Y values. In addition, we can also just round any already existing line to the nearest integer, or whole number:
function setCoords(segment, [x1, y1], [x2, y2]) {
  segment.typeOptions.points[0].x = x1;
  segment.typeOptions.points[0].y = y1;

  segment.typeOptions.points[1].x = x2;
  segment.typeOptions.points[1].y = y2;

  return segment;
}

function roundCoords(segment) {
  const roundedSegment = {
    ...segment,
    typeOptions: {
      ...segment.typeOptions,
      points: segment.typeOptions.points.map((point) => ({
        x: Math.round(point.x),
        y: Math.round(point.y)
      }))
    }
  };

  return roundedSegment;
}

const coords = [
  [[0, 0], [2, 6]],
  [[1, 1], [5, 5]]
]

options.annotations.forEach((annotation, index) => {
  if (annotation.langKey === 'segment') {
    options.annotations[index] = (
      // setCoords(annotation, ...coords.pop());
      roundCoords(annotation)
    )
  }
});
}
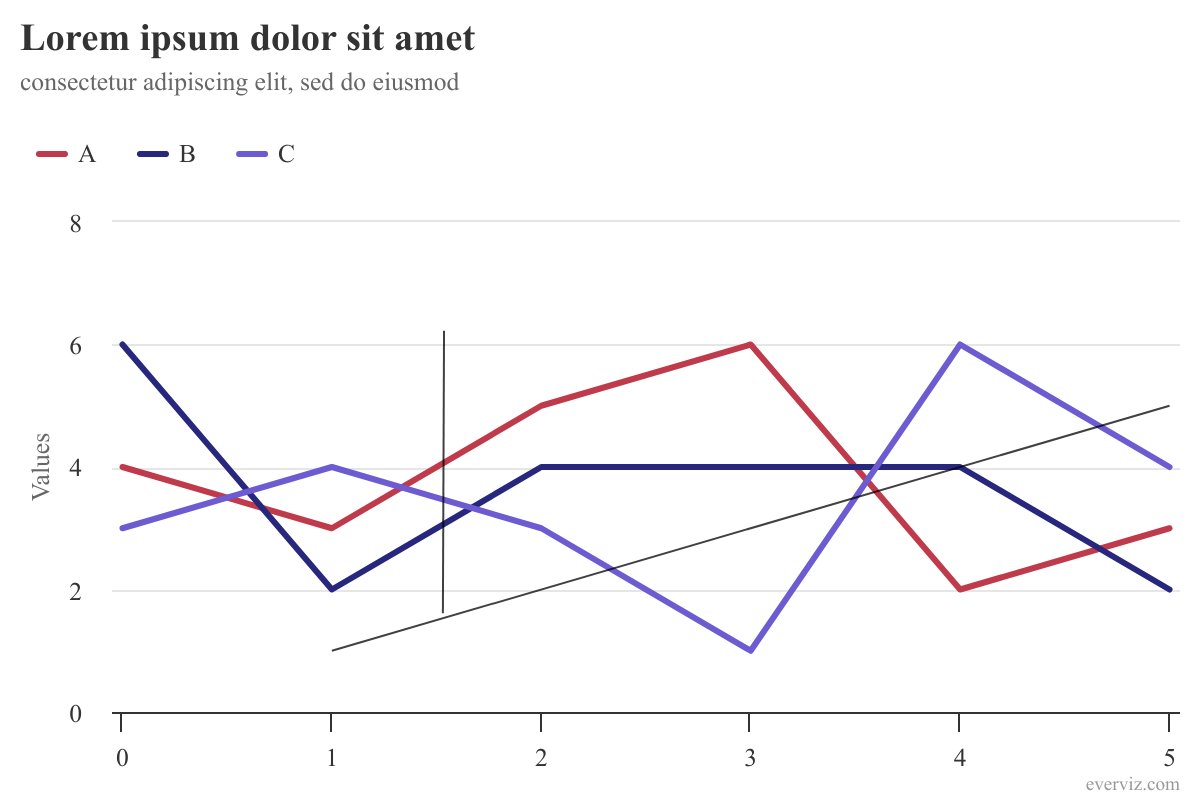
Here’s a chart with two hand-drawn lines rounded automatically to the nearest integer. If I add a third, it too will be placed almost1 automatically.
- The custom code may not affect the line immediately, so you might need to do a random change to the chart, and most likely also revert it.
https://app.everviz.com/create?uuid=-_niXi7DD/?v=2
Now, I think we ought to have the points snap into the closest point when near it, this allows us to easily drag points, but still allow them to be evenly placed.
1 Like
Hi Martin, if I have multiple lines (like 18) what’s the best way to format this code?
Hi Sam, I updated my answer to be a lot more generic. I haven’t tested that this isn’t going to change the style of the line, but I believe it should not. Let me know if something weird happens on your end!
Martin